
Picture Graph Worksheet
Picture Graph with Beach Things — Kindergarten
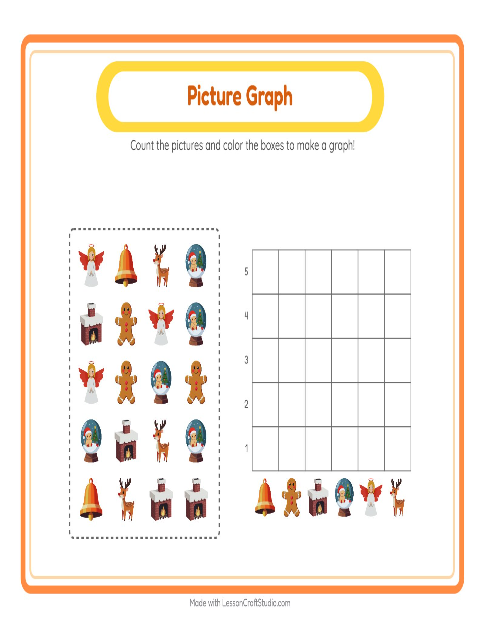
Give a kindergartner the buckets, spades and a starfish and a blank graph, and the task is clear: sort the beach things by kind, count each group, and fill the columns to show the counts. One square per picture keeps the counting honest and checkable. The point is the link between the count and the height — more in a group means a taller column — which is groundwork for the charts they will meet later, met here as something the child builds by hand.
Before numbers on a page mean much, amount has to be something a child can see. A picture graph makes "more" and "fewer" visible as taller and shorter columns the child built themselves by sorting and counting. That is the whole kindergarten goal here — represent how many — kept within small counts so it stays checkable by counting the squares.
Children who like beach things take to this one quickly, and it makes a strong shared lesson: build one column together on the board, then let children finish their own. When this feels easy, sort and count a different set in picture graph with birds, or try picture graph with clothes. You can also browse every picture graph worksheet or the whole beach things collection for kindergarten — each graph prints on a single page or fills in on screen as children tap.
What's inside
- Answer key included
- Print as PDF or play online — free, no sign-up
Updated May 8, 2026
Pictures on this worksheet
- Boat
- Sun Hat
- Ice Cream
- Sandcastle
- Pelican
- Cabana
Try it — interactive
More worksheets to try


More with this theme
- Addition with Beach Things — Kindergarten
- Addition with Beach Things — Kindergarten
- Alphabet Train with Beach Things
- Alphabet Train with Beach Things: Sort the Pictures by First Letter
- Beginning Sounds with Beach Things — Letter B
- Beginning Sounds with Beach Things — Letter C
- Beginning Sounds with Beach Things — Letter D
- Beginning Sounds with Beach Things — Letter F
Interactive activities to try
Math · kindergarten
→
Made with the Picture Graph Worksheets maker
Open the free Chart Count Maker →