Picture Graph Worksheet
Picture Graph with Colors — Kindergarten
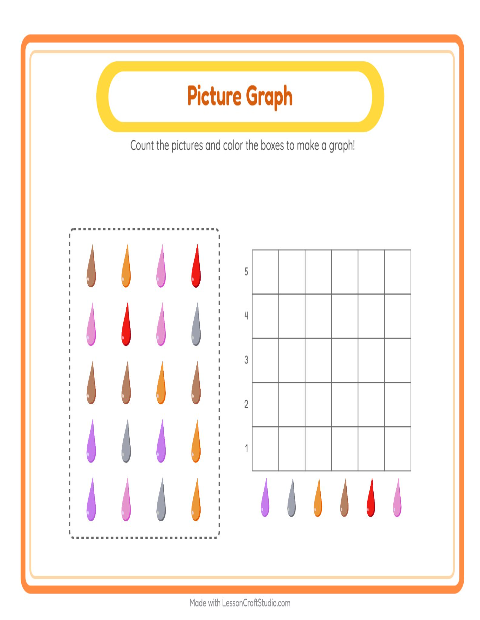
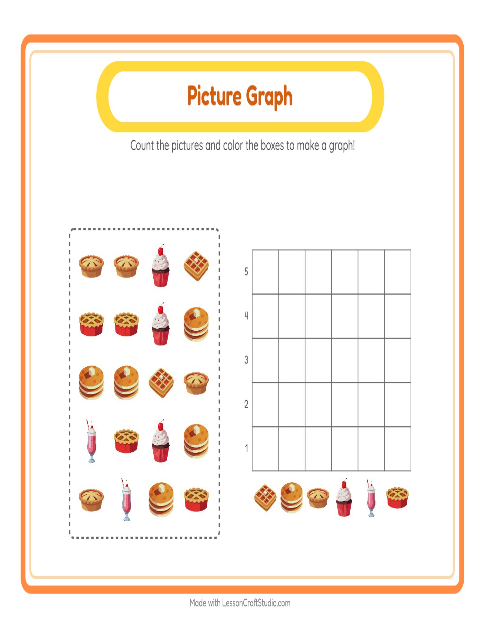
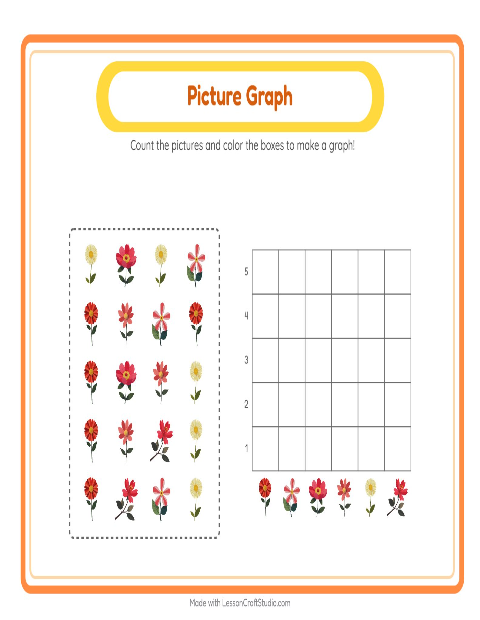
Give a kindergartner the red, blue and yellow and a blank graph, and the task is clear: sort the pictures by color, count each group, and fill the columns to show the counts. One square per picture keeps the counting honest and checkable. The point is the link between the count and the height — more in a group means a taller column — which is groundwork for the charts they will meet later, met here as something the child builds by hand.
Sorting comes before counting, and counting comes before any graph. A child who can gather the pictures into groups and say how many are in each is doing the heart of the work; the columns just hold those counts side by side so they can be compared by height. That ordering — classify, count, represent — is exactly what kindergarten asks for.
Children who like colors take to this one quickly, and it makes a strong shared lesson: build one column together on the board, then let children finish their own. When this feels easy, sort and count a different set in picture graph with desserts and sweets, or try picture graph with fruits. You can also browse every picture graph worksheet or the whole colors collection for kindergarten — each graph prints on a single page or fills in on screen as children tap.
What's inside
- Answer key included
- Print as PDF or play online — free, no sign-up
Updated May 8, 2026
Pictures on this worksheet
- Brown
- Orange
- Pink
- Red
- Gray
- Violet
Try it — interactive
More worksheets to try


More with this theme
Interactive activities to try
Math · kindergarten
→
Made with the Picture Graph Worksheets maker
Open the free Chart Count Maker →