
Picture Graph Worksheet
Picture Graph with Shapes — Kindergarten
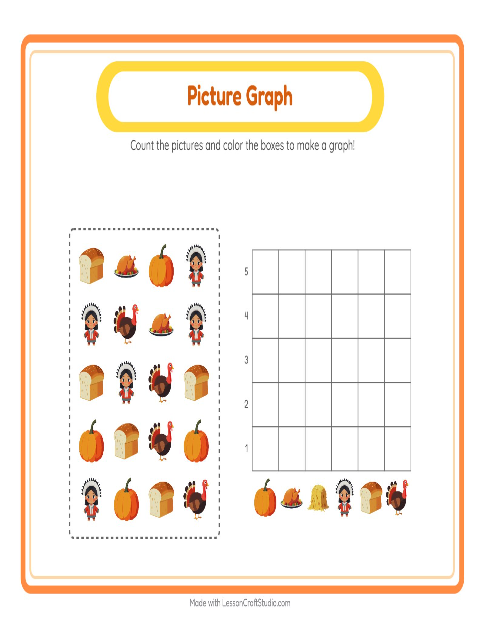
This sheet turns counting into a picture. The child sorts the circles, squares and a triangle by shape, counts each group of pictures, and stacks one square for every picture so the columns rise to match. Nothing here asks the child to read a finished chart — they make it. Seeing that the group they counted the most of has the tallest column is the quiet start of showing how many, and it stays grounded in the pictures the whole way.
Sorting into categories and counting each category is named directly in the kindergarten standards, and representing those counts is its companion. Doing both with pictures a child can move and point to keeps the idea concrete: the graph is a record of their counting, built one square at a time, not a chart handed to them already finished.
Children who like shapes take to this one quickly, and it makes a strong shared lesson: build one column together on the board, then let children finish their own. When this feels easy, sort and count a different set in picture graph with space, or try picture graph with vegetables. You can also browse every picture graph worksheet or the whole shapes collection for kindergarten — each graph prints on a single page or fills in on screen as children tap.
What's inside
- Answer key included
- Print as PDF or play online — free, no sign-up
Updated May 8, 2026
Pictures on this worksheet
- Triangle
- Heptagon
- Heart
- Parallelogram
- Cone
Try it — interactive
More worksheets to try


More with this theme
Interactive activities to try
Math · kindergarten
→
Made with the Picture Graph Worksheets maker
Open the free Chart Count Maker →