
Picture Graph Worksheet
Picture Graph with Vegetables — Kindergarten
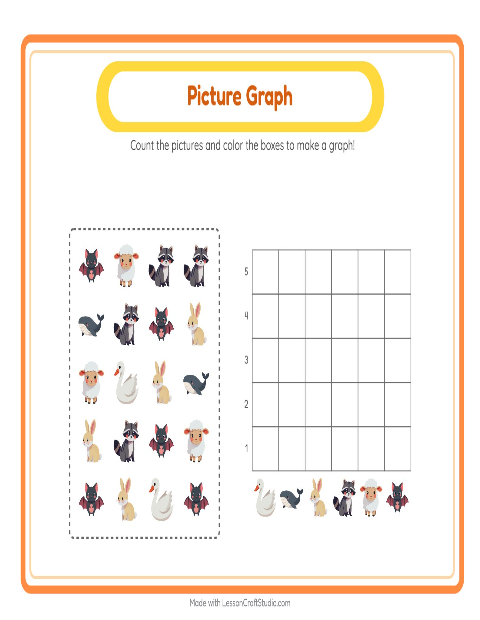
This kindergarten worksheet shows a scatter of carrots, peas and a pumpkin above an empty graph. The child sorts the vegetables by kind — gathering the same ones together — counts how many there are in each group, and fills a column up to the matching height, building a simple picture graph one square at a time. The graph grows straight out of the child's own counting, so each bar means something they made themselves rather than something handed to them.
A picture graph is the gentlest way to show how many. There is no scale to read and no number sentences to solve — one square stands for one thing the child counted, so the graph is only ever as true as their own sorting and counting. That keeps the focus on the real skill — group, then count — not on a finished chart someone else made.
Children who like vegetables take to this one quickly, and it makes a strong shared lesson: build one column together on the board, then let children finish their own. When this feels easy, sort and count a different set in picture graph with vehicles, or try picture graph with supermarket things. You can also browse every picture graph worksheet or the whole vegetables collection for kindergarten — each graph prints on a single page or fills in on screen as children tap.
What's inside
- Answer key included
- Print as PDF or play online — free, no sign-up
Updated May 8, 2026
Pictures on this worksheet
- Mushroom
- Lettuce
- Parsnip
- Cucumber
- Chili Pepper
- Cauliflower
Try it — interactive
More worksheets to try


More with this theme
- Addition with Vegetables — Kindergarten
- Addition with Vegetables — Kindergarten
- Alphabet Train with Vegetables: Sort the Pictures by First Letter
- Alphabet Train with Vegetables
- Big and Small with Vegetables
- Order by Size with Vegetables
- Secret Word Math with Vegetables — Grade 2
- Secret Code Math with Vegetables — Grade 2
Interactive activities to try
Math · kindergarten
→
Made with the Picture Graph Worksheets maker
Open the free Chart Count Maker →