Most of All — Toys
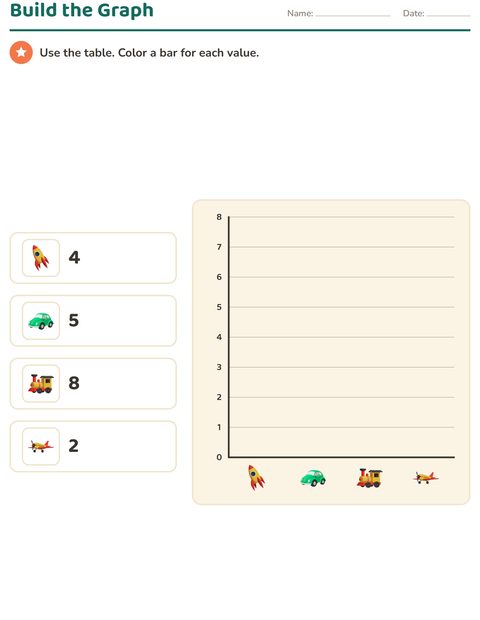
Look at the graph. Circle the one with the MOST.

Look at the graph. Circle the one with the MOST.
Most of All — Look at the graph. Circle the one with the MOST. Reading bar graphs, pictographs and tally charts teaches children to organize data and answer questions about it. Pictures on this sheet: Shovel, Robot, Car and Blocks.
Keep a small stack by the desk for children who finish other work ahead of the group.