Build the Graph — Toys
Use the table. Color a bar for each value.

Use the table. Color a bar for each value.
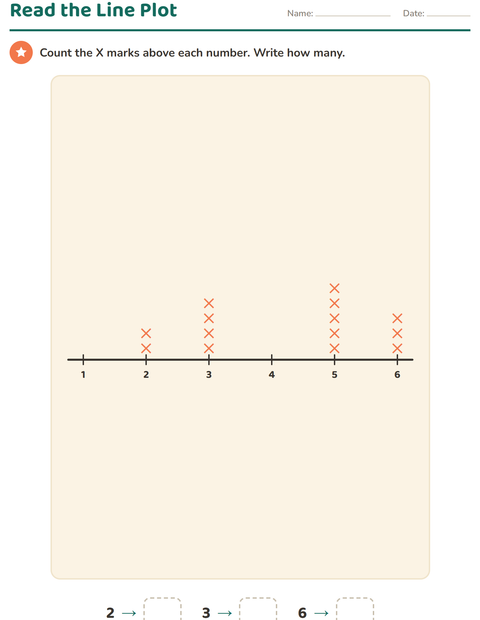
Build the Graph — Use the table. Color a bar for each value. Reading bar graphs, pictographs and tally charts teaches children to organize data and answer questions about it. Pictures on this sheet: Rocket, Cards, Truck and Baby.
Slot it into a weekly math rotation, where one group works on this while another meets the teacher.