Picture Graph Worksheet
Picture Graph with Fruits — Kindergarten
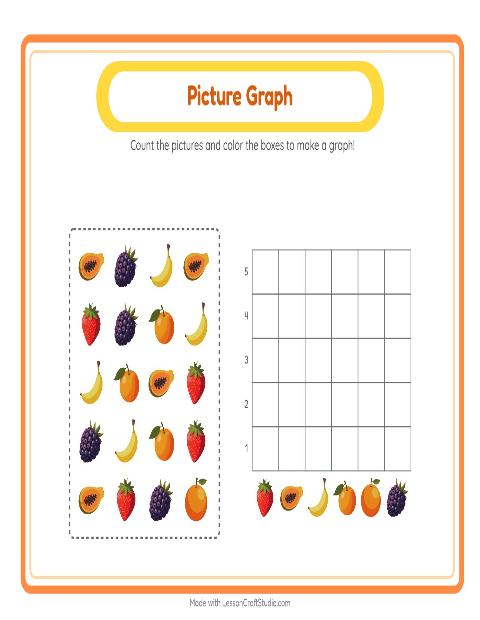
Each picture on this sheet belongs in one group. The child looks at the apples, bananas and a pear, sorts the fruit by kind, and colors one square of a group's column for every picture that belongs there. Counting as they go, they end with a graph where the tallest column is simply the group that had the most. Sort first, then count, then show the count as height — that order is the whole idea, kept concrete with pictures a five-year-old can point to.
Before numbers on a page mean much, amount has to be something a child can see. A picture graph makes "more" and "fewer" visible as taller and shorter columns the child built themselves by sorting and counting. That is the whole kindergarten goal here — represent how many — kept within small counts so it stays checkable by counting the squares.
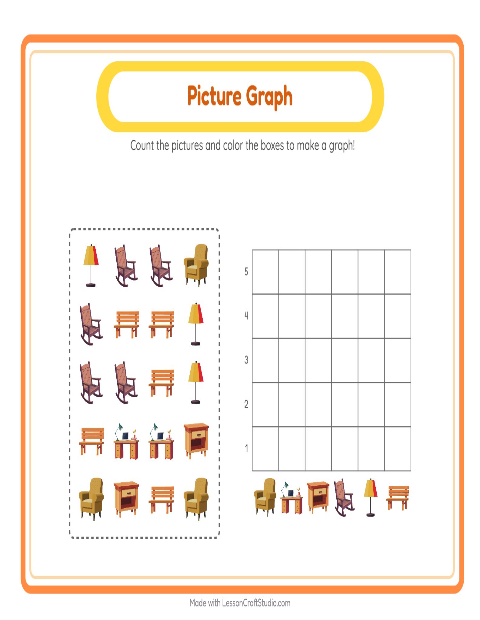
Children who like fruits take to this one quickly, and it makes a strong shared lesson: build one column together on the board, then let children finish their own. When this feels easy, sort and count a different set in picture graph with furniture, or try picture graph with community helpers. You can also browse every picture graph worksheet or the whole fruit collection for kindergarten — each graph prints on a single page or fills in on screen as children tap.
What's inside
- Answer key included
- Print as PDF or play online — free, no sign-up
Updated May 8, 2026
Pictures on this worksheet
- Papaya
- Blackberry
- Banana
- Strawberry
- Clementine
- Orange
Try it — interactive
More worksheets to try


More with this theme
- Addition with Fruits — Kindergarten
- Addition with Fruits — Kindergarten
- Alphabet Train with Fruits
- Alphabet Train with Fruits: Sort the Pictures by First Letter
- Beginning Sounds with Fruits — Letter A
- Beginning Sounds with Fruits — Letter B
- Beginning Sounds with Fruits — Letter C
- Beginning Sounds with Fruits — Letter D
Interactive activities to try
Math · kindergarten
→
Made with the Picture Graph Worksheets maker
Open the free Chart Count Maker →