
Picture Graph Worksheet
Picture Graph with Tools — Kindergarten
Each picture on this sheet belongs in one group. The child looks at the hammers, saws and a wrench, sorts the tools by kind, and colors one square of a group's column for every picture that belongs there. Counting as they go, they end with a graph where the tallest column is simply the group that had the most. Sort first, then count, then show the count as height — that order is the whole idea, kept concrete with pictures a five-year-old can point to.
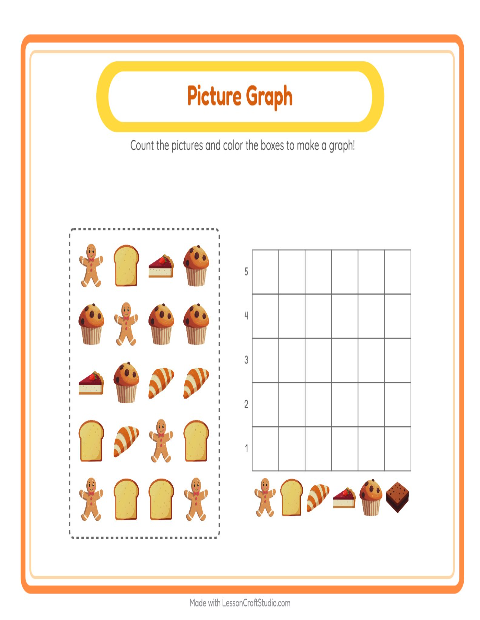
A picture graph is the gentlest way to show how many. There is no scale to read and no number sentences to solve — one square stands for one thing the child counted, so the graph is only ever as true as their own sorting and counting. That keeps the focus on the real skill — group, then count — not on a finished chart someone else made.
Children who like tools take to this one quickly, and it makes a strong shared lesson: build one column together on the board, then let children finish their own. When this feels easy, sort and count a different set in picture graph with toys, or try picture graph with accessories. You can also browse every picture graph worksheet or the whole tools collection for kindergarten — each graph prints on a single page or fills in on screen as children tap.
What's inside
- Answer key included
- Print as PDF or play online — free, no sign-up
Updated May 8, 2026
Pictures on this worksheet
- Ladder
- Hammer
- Tape Measure
- Handsaw
- Paint Brush
- Electric Drill
Try it — interactive
More worksheets to try


More with this theme
Interactive activities to try
Math · kindergarten
→
Made with the Picture Graph Worksheets maker
Open the free Chart Count Maker →