
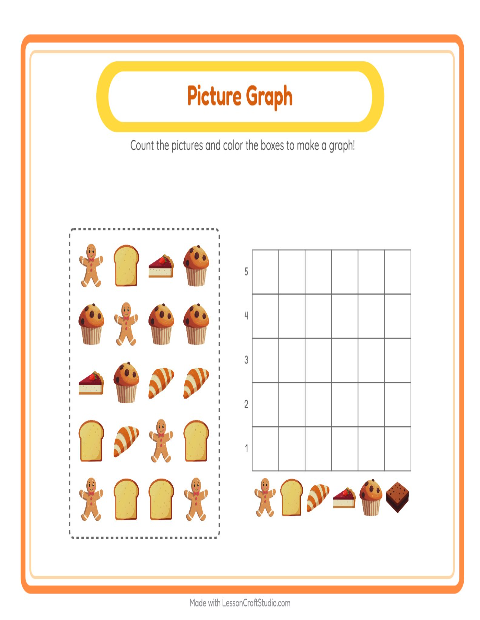
Picture Graph Worksheet
Picture Graph with Bakery Treats — Kindergarten
Each picture on this sheet belongs in one group. The child looks at the bagels, buns and a cake, sorts the bakery treats by kind, and colors one square of a group's column for every picture that belongs there. Counting as they go, they end with a graph where the tallest column is simply the group that had the most. Sort first, then count, then show the count as height — that order is the whole idea, kept concrete with pictures a five-year-old can point to.
The last number you count in a group names how many are in it — and that count becomes the height of the column. Linking the count to the height is the understanding kindergartners are building: a column is tall because the child counted more there, short because they counted fewer. Pictured groups keep it something they can check by counting again.
Children who like bakery treats take to this one quickly, and it makes a strong shared lesson: build one column together on the board, then let children finish their own. When this feels easy, sort and count a different set in picture graph with beach things, or try picture graph with classroom objects. You can also browse every picture graph worksheet or the whole bakery treats collection for kindergarten — each graph prints on a single page or fills in on screen as children tap.
What's inside
- Answer key included
- Print as PDF or play online — free, no sign-up
Updated May 8, 2026
Pictures on this worksheet
- Gingerbread Man
- Toast
- Tart
- Muffin
- Croissant
Try it — interactive
More worksheets to try



More with this theme
- Addition with Bakery Treats — Kindergarten
- Addition with Bakery Treats — Kindergarten
- Beginning Sounds with Bakery Treats — Letter B
- Beginning Sounds with Bakery Treats — Letter C
- Beginning Sounds with Bakery Treats — Letter D
- Beginning Sounds with Bakery Treats — Letter E
- Beginning Sounds with Bakery Treats — Letter G
- Beginning Sounds with Bakery Treats — Letter M
Interactive activities to try
Math · kindergarten
→
Made with the Picture Graph Worksheets maker
Open the Chart Count Maker →