Read the Line Plot — Shapes
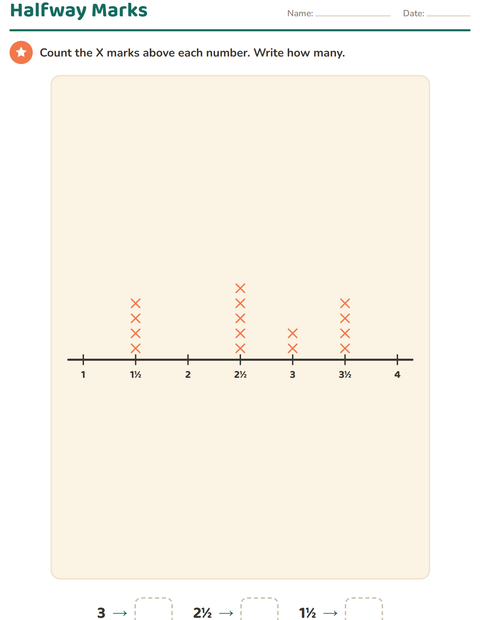
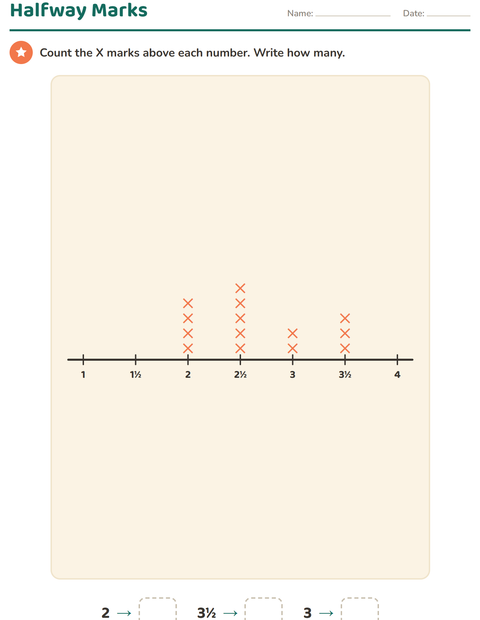
Count the X marks above each number. Write how many.

Count the X marks above each number. Write how many.
Read the Line Plot — Count the X marks above each number. Write how many. Reading bar graphs, pictographs and tally charts teaches children to organize data and answer questions about it.
Two children can sit side by side, take a problem each, and compare how they reached the number.