Picture Graph Worksheet
Picture Graph with Farm Animals — Kindergarten
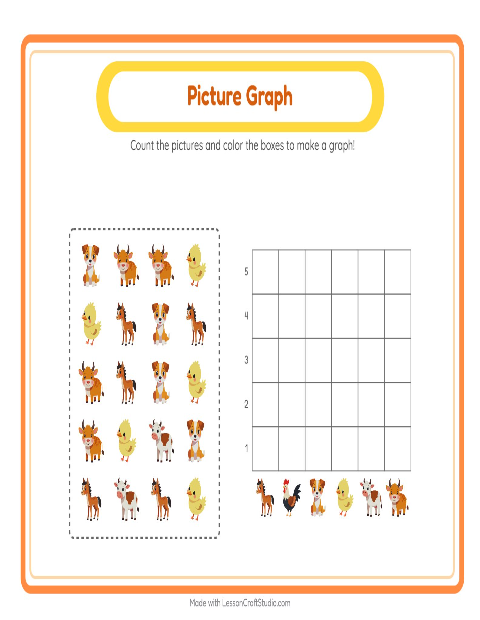
Before any graph makes sense, a child has to put things into groups and count each group. That is exactly what this sheet asks: take the cows, pigs and a goat, sort the farm animals by kind, count how many are in each, and build the columns to match. The picture graph is just a tidy way of standing those counts side by side, so the child can see at a glance which group had more and which had fewer — by looking, not by being told.
Before numbers on a page mean much, amount has to be something a child can see. A picture graph makes "more" and "fewer" visible as taller and shorter columns the child built themselves by sorting and counting. That is the whole kindergarten goal here — represent how many — kept within small counts so it stays checkable by counting the squares.
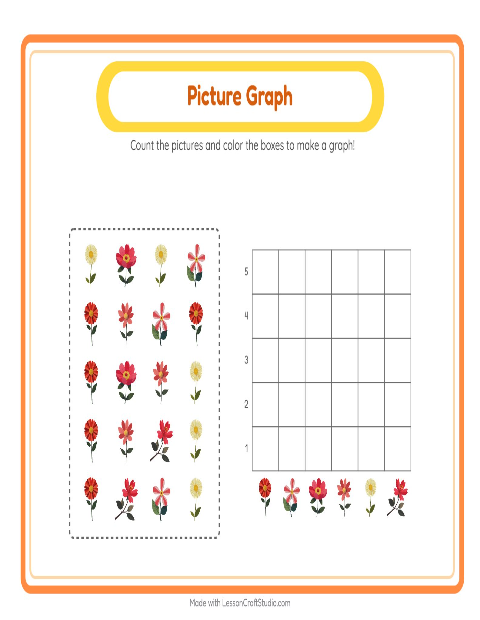
Children who like farm animals take to this one quickly, and it makes a strong shared lesson: build one column together on the board, then let children finish their own. When this feels easy, sort and count a different set in picture graph with flowers, or try picture graph with kitchen tools. You can also browse every picture graph worksheet or the whole farm animals collection for kindergarten — each graph prints on a single page or fills in on screen as children tap.
What's inside
- Answer key included
- Print as PDF or play online — free, no sign-up
Updated May 8, 2026
Pictures on this worksheet
- Dog
- Ox
- Chick
- Foal
- Calf
Try it — interactive
More worksheets to try


More with this theme
- Addition with Farm Animals — Kindergarten
- Addition with Farm Animals — Kindergarten
- Alphabet Train with Farm Animals
- Alphabet Train with Farm Animals: Sort the Pictures by First Letter
- Beginning Sounds with Farm Animals — Letter B
- Beginning Sounds with Farm Animals — Letter C
- Beginning Sounds with Farm Animals — Letter D
- Beginning Sounds with Farm Animals — Letter F
Interactive activities to try
Math · kindergarten
→
Made with the Picture Graph Worksheets maker
Open the free Chart Count Maker →