Picture Graph Worksheet
Picture Graph with Household Things — Kindergarten
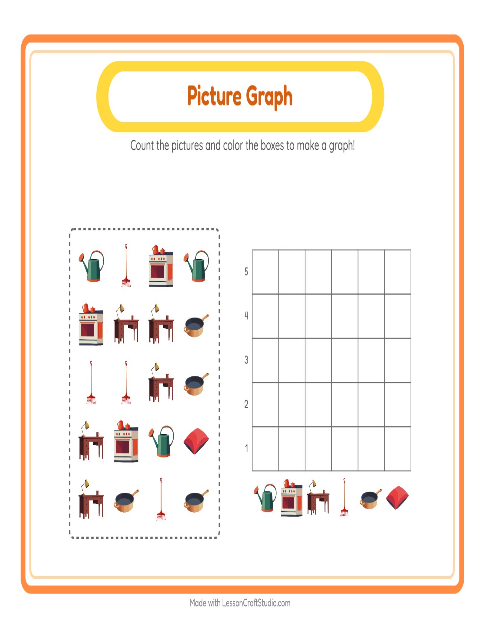
Here the child is the one who makes the graph. They take the scattered lamps, chairs and a clock, sort the household things by kind into the columns, and count how many go in each, coloring a square at a time. Because every square stands for one picture they counted, the finished graph is theirs to read: the tallest column is the group with the most. Sorting, counting, and showing the count as height — kept small and concrete — is the kindergarten skill, no chart-reading required.
Before numbers on a page mean much, amount has to be something a child can see. A picture graph makes "more" and "fewer" visible as taller and shorter columns the child built themselves by sorting and counting. That is the whole kindergarten goal here — represent how many — kept within small counts so it stays checkable by counting the squares.
Children who like household things take to this one quickly, and it makes a strong shared lesson: build one column together on the board, then let children finish their own. When this feels easy, sort and count a different set in picture graph with supermarket things, or try picture graph with camping gear. You can also browse every picture graph worksheet or the whole household things collection for kindergarten — each graph prints on a single page or fills in on screen as children tap.
What's inside
- Answer key included
- Print as PDF or play online — free, no sign-up
Updated May 8, 2026
Pictures on this worksheet
- Watering Can
- Rake
- Stove
- Desk
- Pan
- Cushion
Try it — interactive
More worksheets to try

More with this theme
- Addition with Household Things — Kindergarten
- Addition with Household Things — Kindergarten
- Alphabet Train with Household Things
- Alphabet Train with Household Things: Sort the Pictures by First Letter
- Beginning Sounds with Household Things — Letter A
- Beginning Sounds with Household Things — Letter B
- Beginning Sounds with Household Things — Letter C
- Beginning Sounds with Household Things — Letter D
Interactive activities to try
Math · kindergarten
→
Made with the Picture Graph Worksheets maker
Open the free Chart Count Maker →