Picture Graph Worksheet
Picture Graph with Supermarket Things — Kindergarten
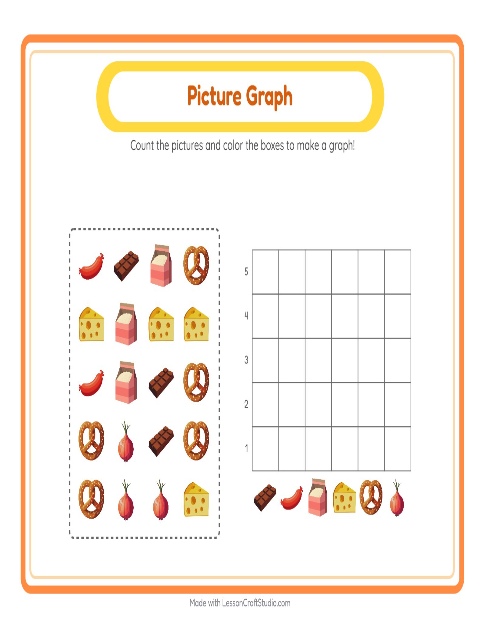
Sorting and counting come first; the graph only records them. A child works through the carts, baskets and a till, sorts the supermarket things by kind, and counts how many landed in each group. Filling a column to that height turns the count into something they can see — a taller bar for the group that had more. With the amounts kept small, a kindergartner builds the whole graph from their own counting rather than copying a finished one.
Comparing groups is easy once they are graphed: the taller column had more, the shorter had fewer. Kindergartners are not asked to say what the bars mean or why — only to build the columns from what they sorted and counted, and to see that height shows amount. Keeping the groups small means every column can be checked square by square.
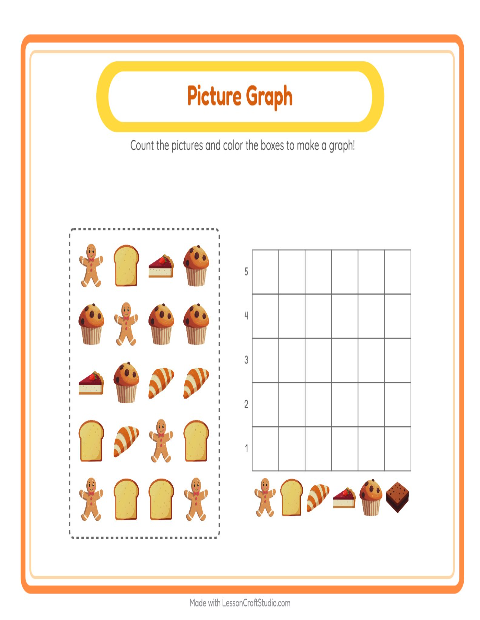
Children who like supermarket things take to this one quickly, and it makes a strong shared lesson: build one column together on the board, then let children finish their own. When this feels easy, sort and count a different set in picture graph with bakery treats, or try picture graph with christmas. You can also browse every picture graph worksheet or the whole supermarket things collection for kindergarten — each graph prints on a single page or fills in on screen as children tap.
What's inside
- Answer key included
- Print as PDF or play online — free, no sign-up
Updated May 8, 2026
Pictures on this worksheet
- Sausage
- Chocolate Bar
- Rice
- Pretzels
- Cheese
- Onion
Try it — interactive
More worksheets to try

More with this theme
- Addition with Supermarket Things — Kindergarten
- Addition with Supermarket Things — Kindergarten
- Alphabet Train with Supermarket Things
- Alphabet Train with Supermarket Things: Sort the Pictures by First Letter
- Beginning Sounds with Supermarket Things — Letter A
- Beginning Sounds with Supermarket Things — Letter B
- Beginning Sounds with Supermarket Things — Letter C
- Beginning Sounds with Supermarket Things — Letter D
Interactive activities to try
Math · kindergarten
→
Made with the Picture Graph Worksheets maker
Open the free Chart Count Maker →