Tutorial
1
Open the Chart Count Worksheet Maker
Navigate to the Chart Count Worksheet Maker page and click the launch button to open the generator in your browser. The tool loads instantly with a settings sidebar on the left and a dual-tab canvas on the right — one tab for the worksheet, one for the answer key. No account creation, no software download, no installation required — start building picture graph worksheets immediately.
The settings sidebar contains all the controls you will use: page setup, image source selection, theme browser, text tools, background and border themes, name/date fields, grayscale toggle, and export buttons. The dual-tab canvas is where you preview and edit the generated worksheet and its matching answer key. Take a moment to explore both canvas tabs to understand the dual-canvas system before generating your first worksheet.
2
Set Your Page Layout and Decorations
In the Page Setup section, select your page size: Letter Portrait, Letter Landscape, A4 Portrait, A4 Landscape, Square (1200×1200), or enter custom dimensions. Letter is standard for North American buyers on Etsy and Gumroad. A4 is standard for European and international markets. Square is ideal for social media previews and Instagram-friendly product images. Creating Letter and A4 versions doubles your addressable market with minimal additional effort.
Set your page background color for the base canvas. Then select a themed background pattern from the built-in library with an adjustable opacity slider (0–1, step 0.05). A subtle background at 15 to 25 percent opacity adds visual warmth without competing with the scattered image grid and bar chart. Layer a decorative border frame from the border library with its own independent opacity control. Background and border themes work independently, so you can mix and match combinations freely. Consistent background and border pairings across a product bundle create a cohesive branded look that buyers associate with quality.
3
Choose Your Image Source
The Image Library panel provides three approaches for selecting the 6 image types that will appear on your worksheet.
Automatic selection is the fastest path. Use the Worksheet Image Source dropdown to select a theme like Animals, Food, or Vehicles. The app randomly picks 6 images from that collection, guaranteeing variety within the theme. This mode is ideal for batch production where you need to generate many unique worksheets quickly.
Manual selection gives you precise control. Browse the Image Library by theme or search by keyword, then click exactly 6 images to select them. Selected images appear in a preview strip where you can click to remove and replace individual picks. Manual mode is ideal for premium products where you want curated image combinations — specific animals from different habitats, seasonal items that match a holiday theme, or cross-category images for eclectic worksheets.
No-theme mode selects 6 random images from all available collections, creating unexpected image combinations for variety-focused products. Every mode guarantees exactly 6 image types per worksheet for consistent chart formatting. You can also upload custom PNG, JPG, or GIF images for branded or niche-specific content that goes beyond the 104 built-in themed collections with 3,100+ illustrations.
4
Generate the Picture Graph Worksheet
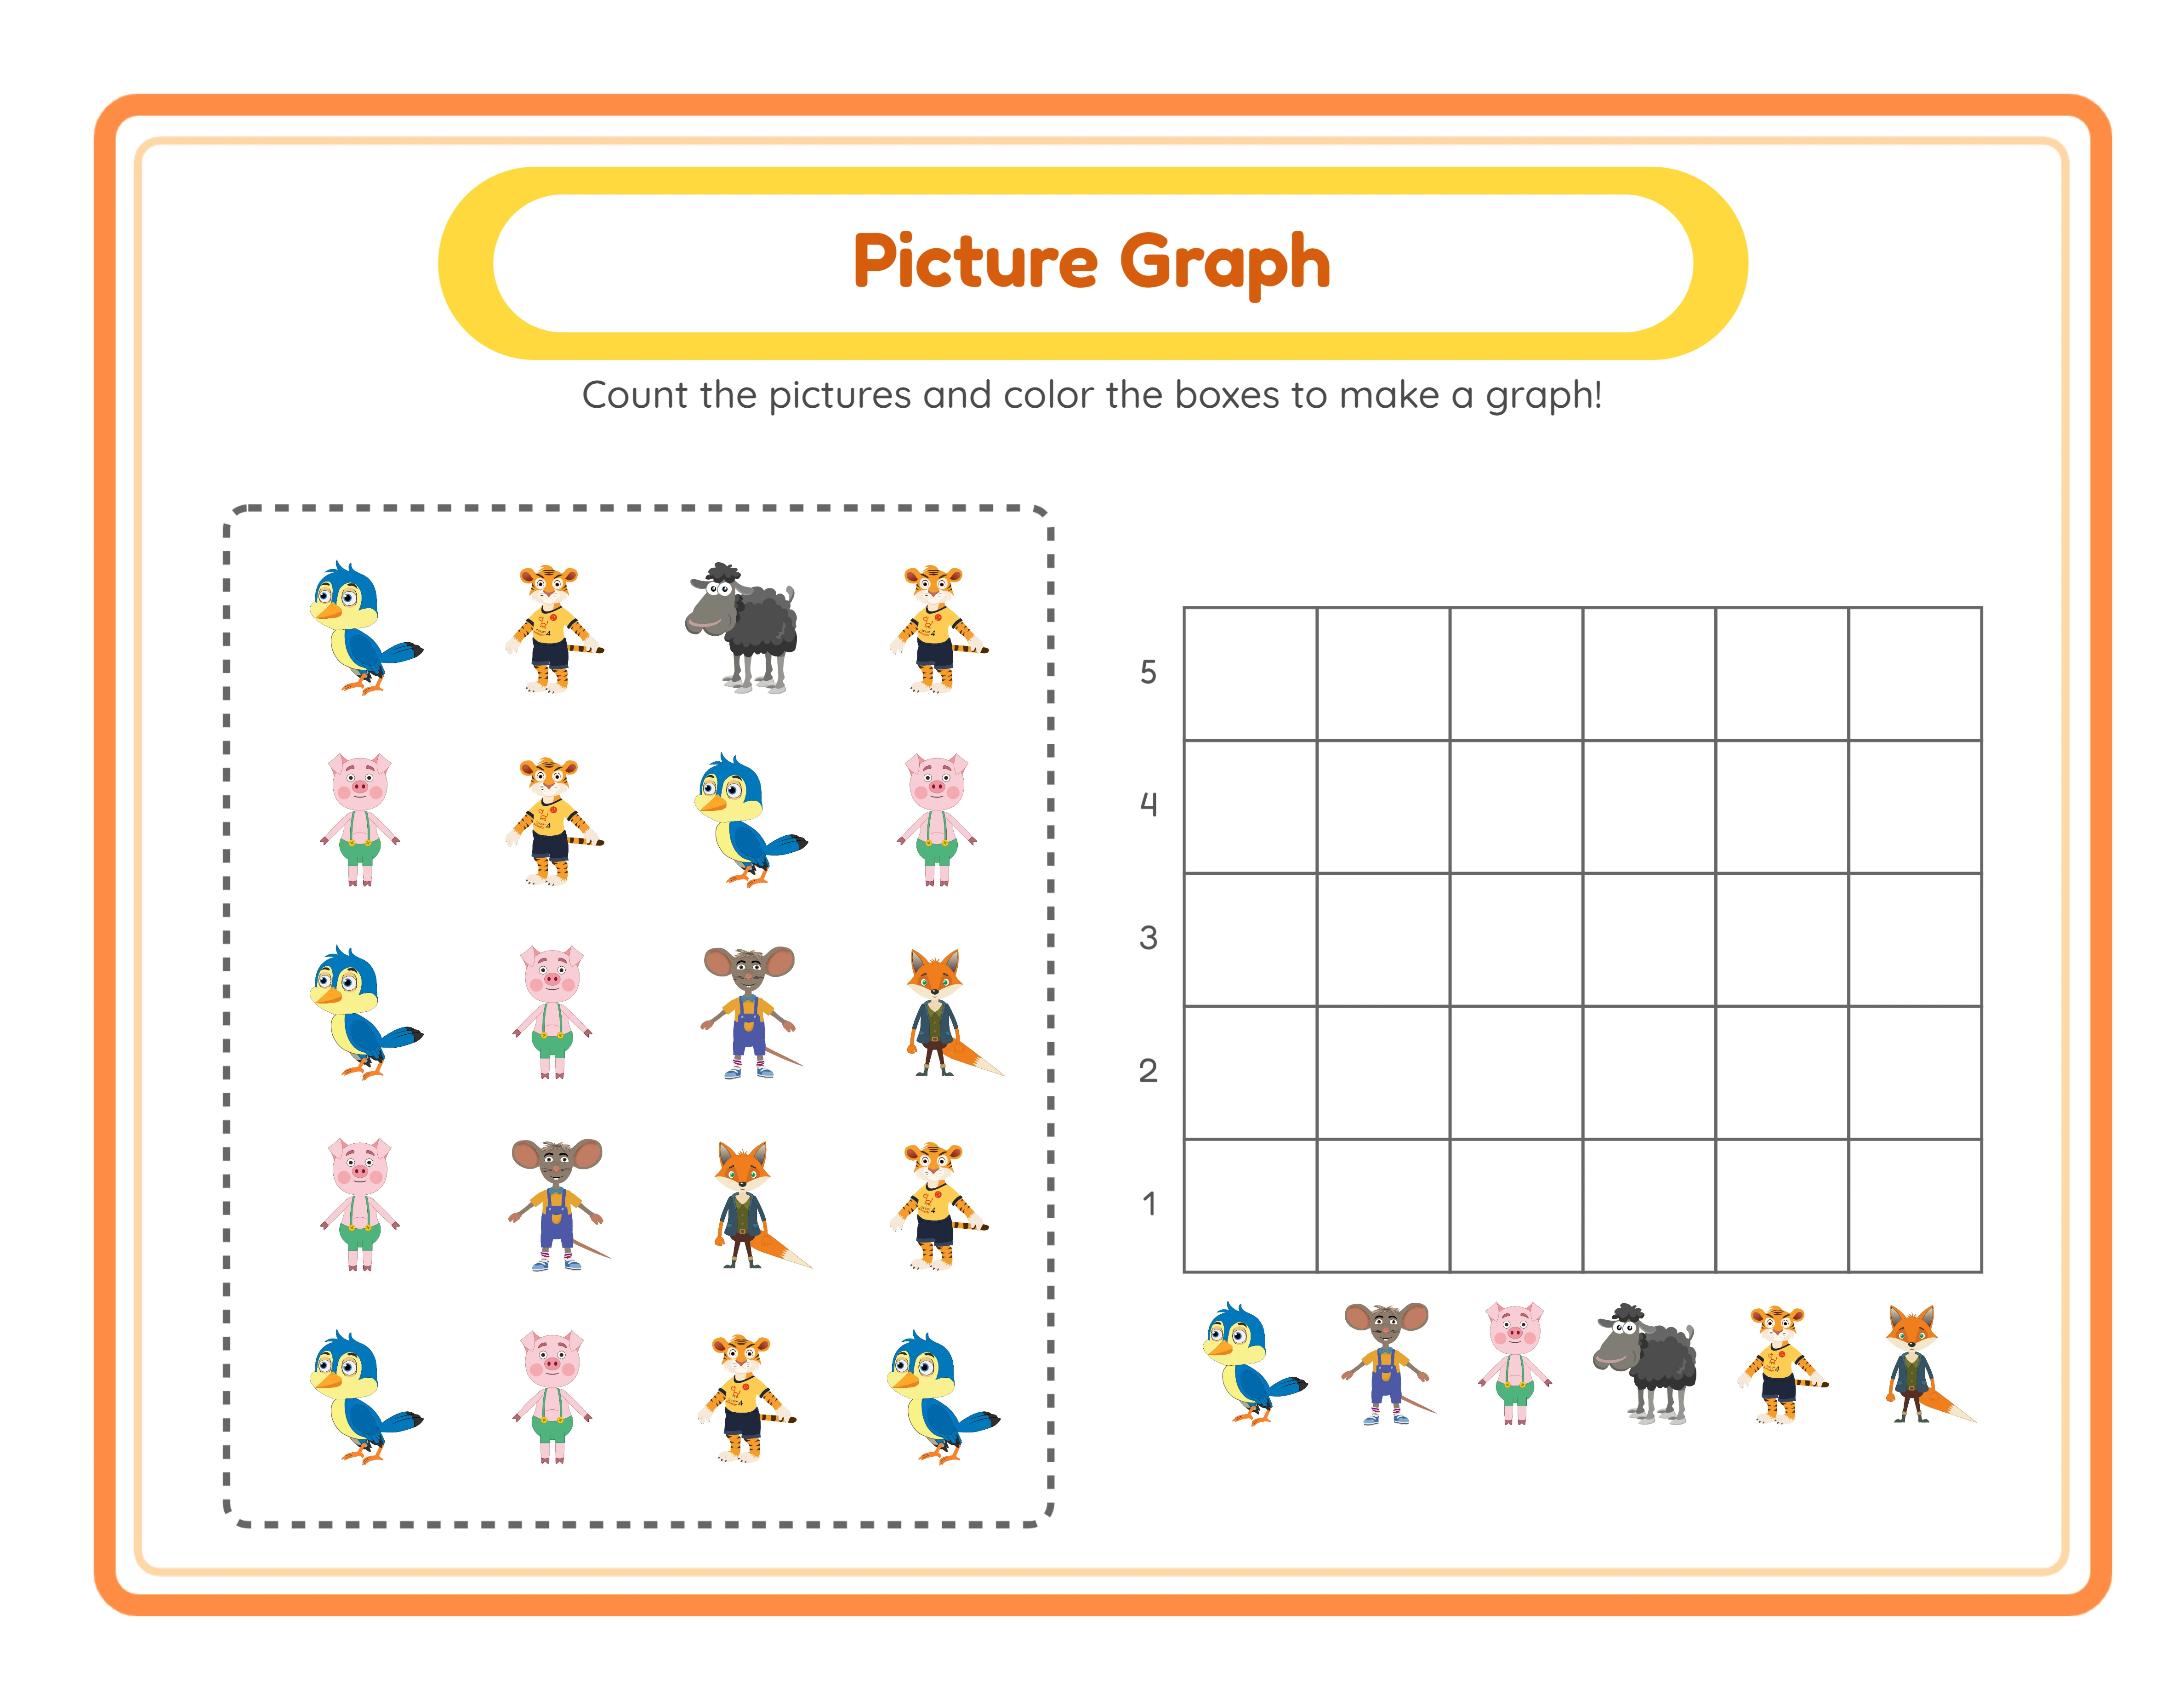
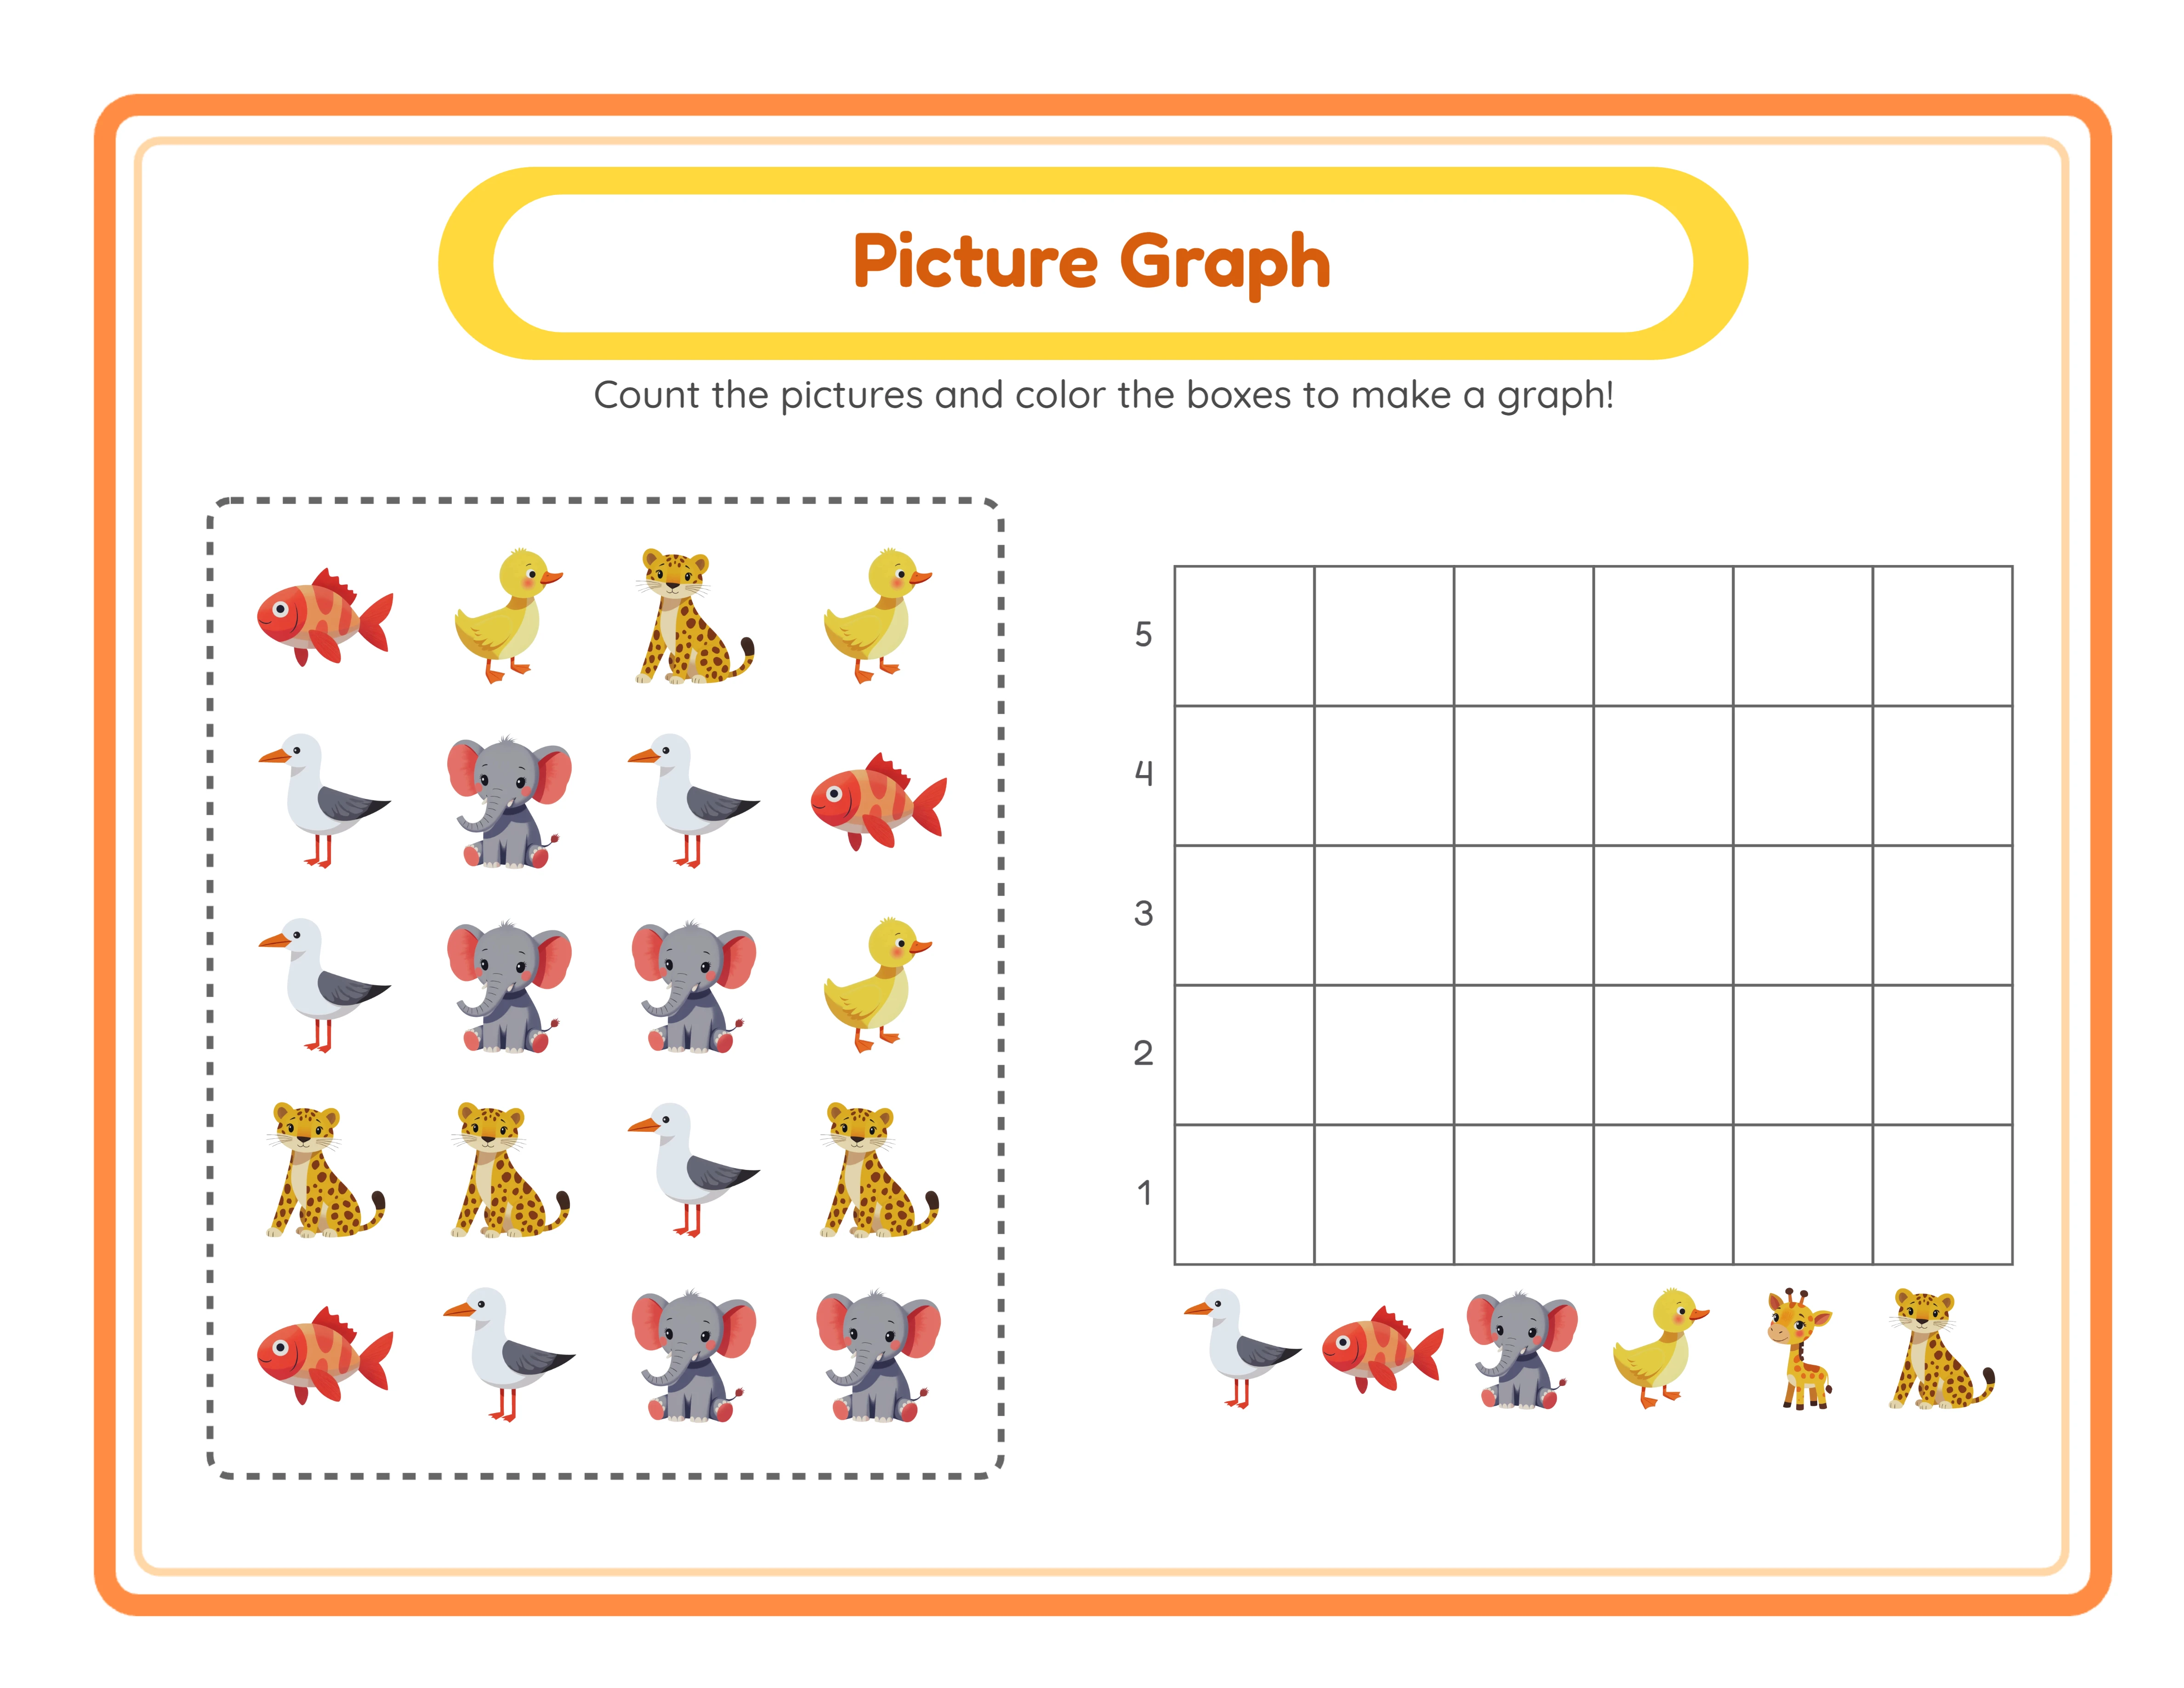
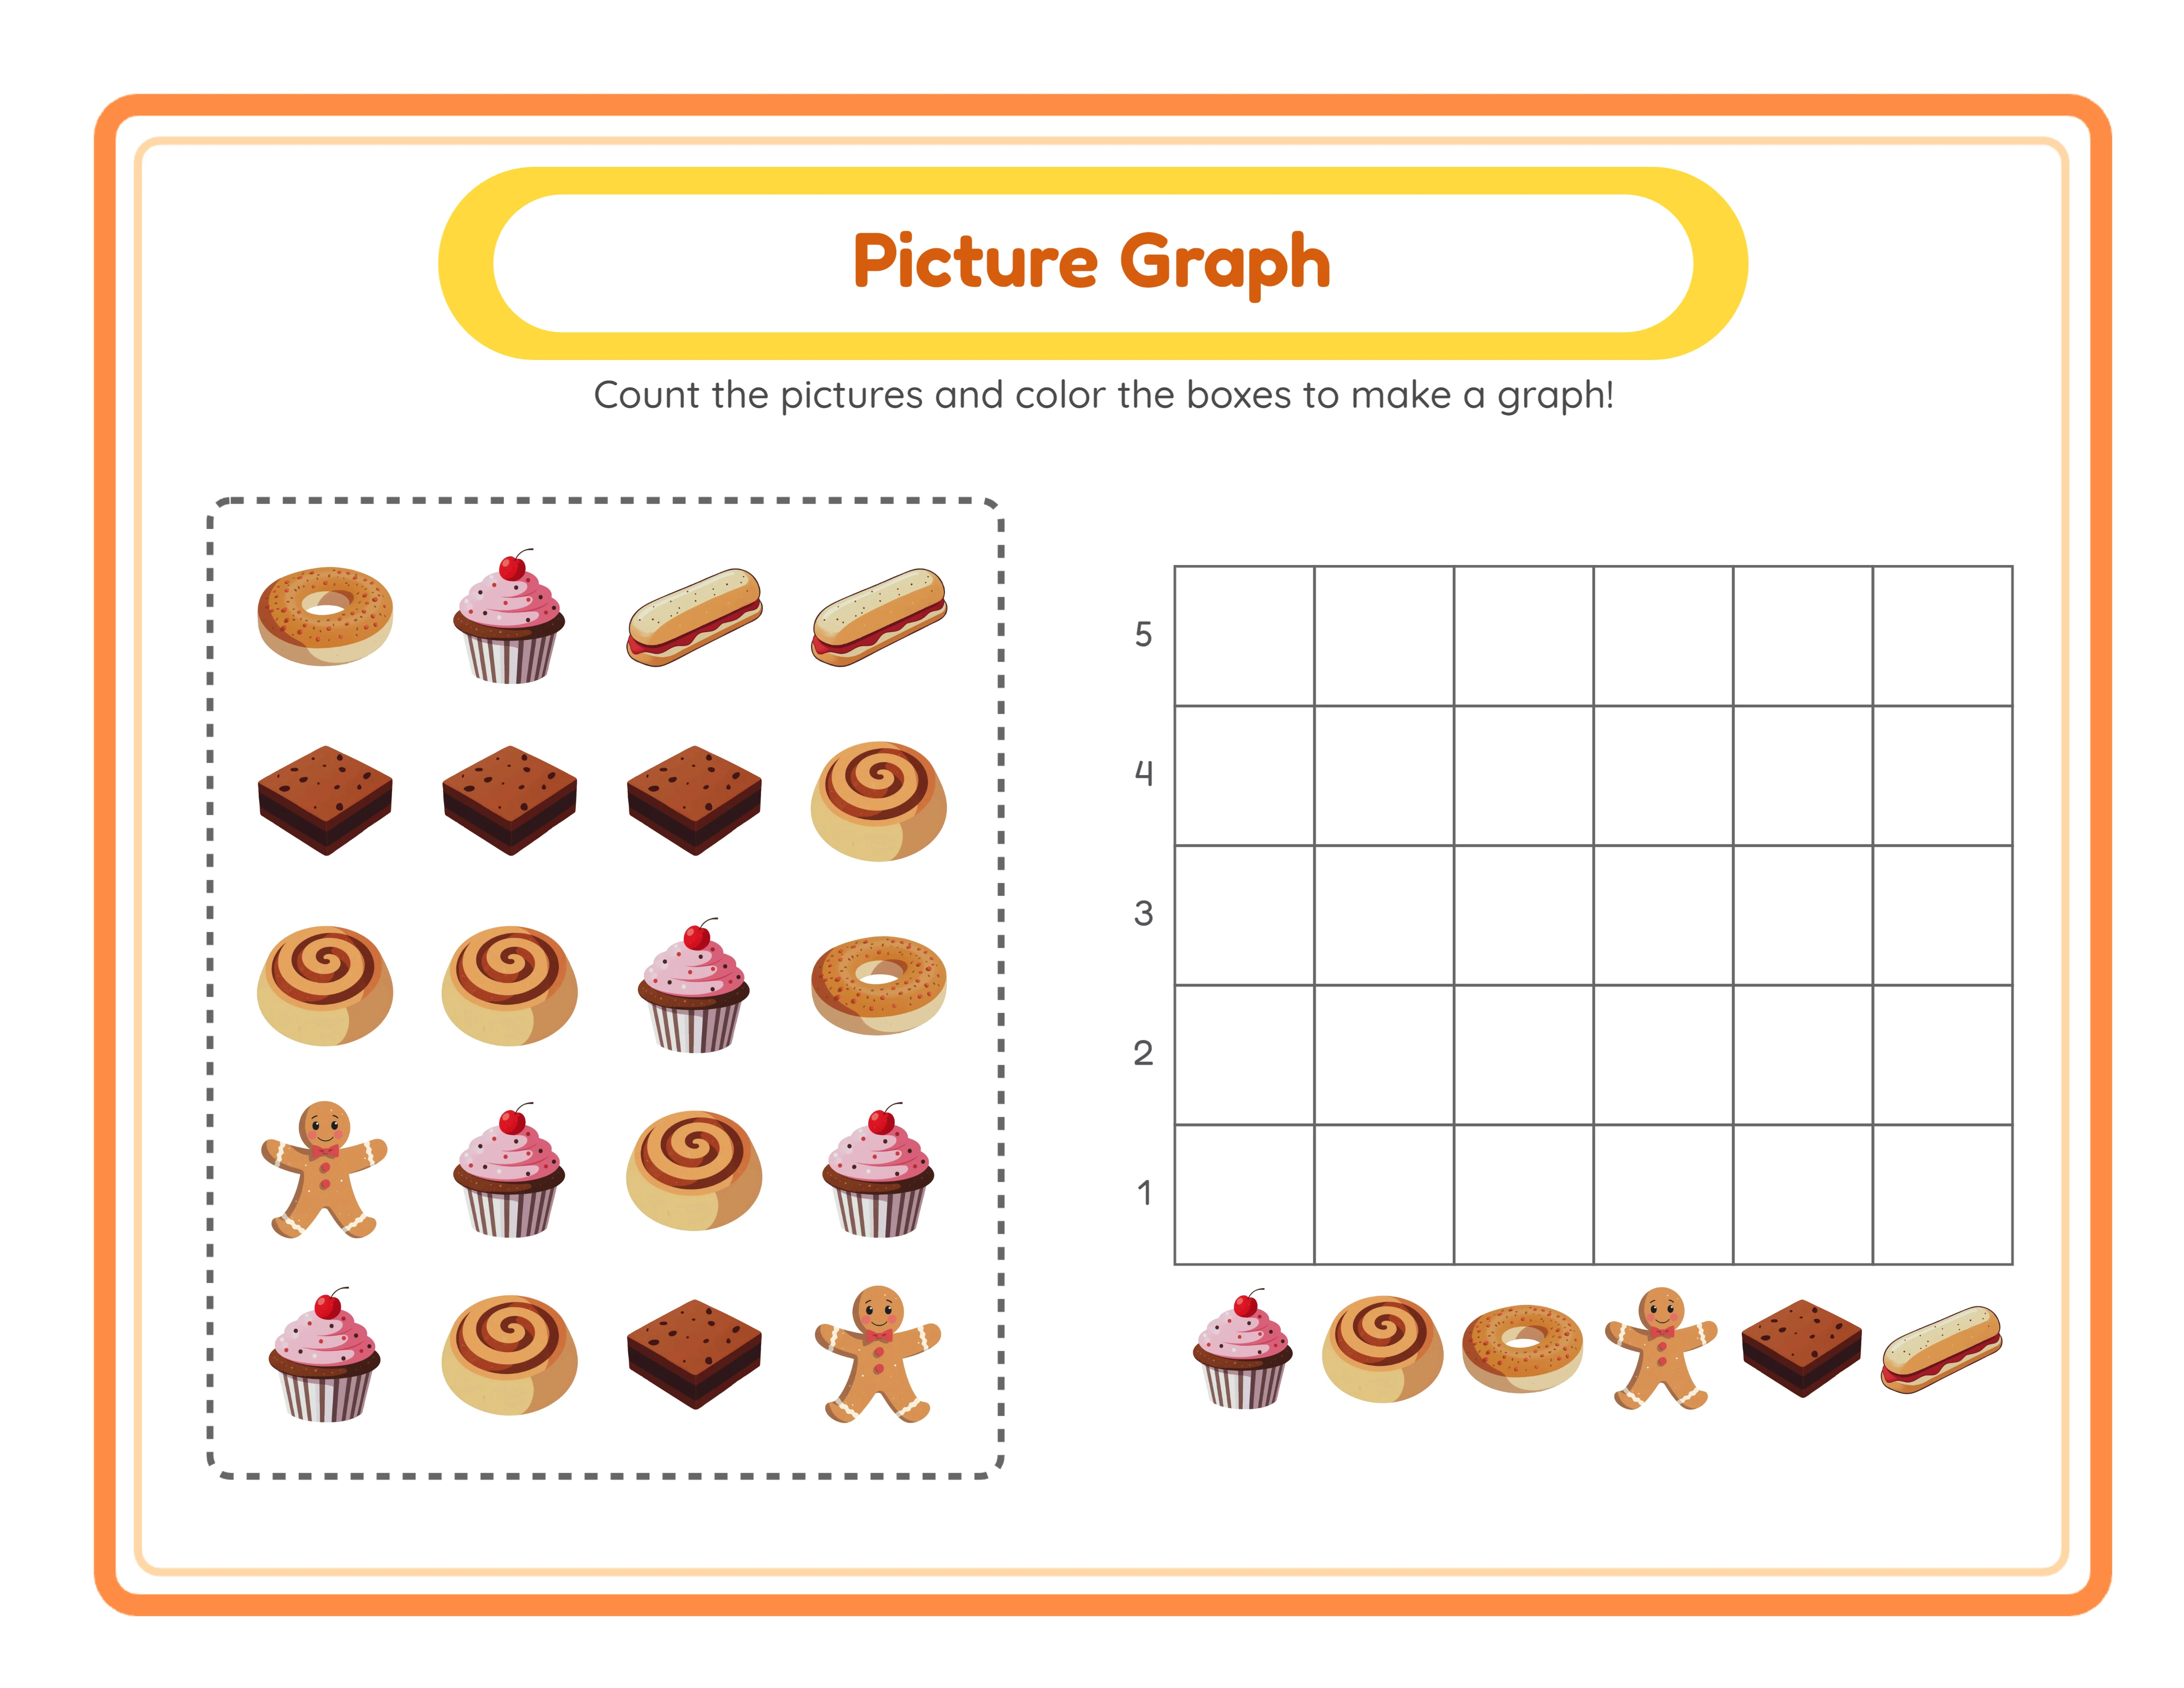
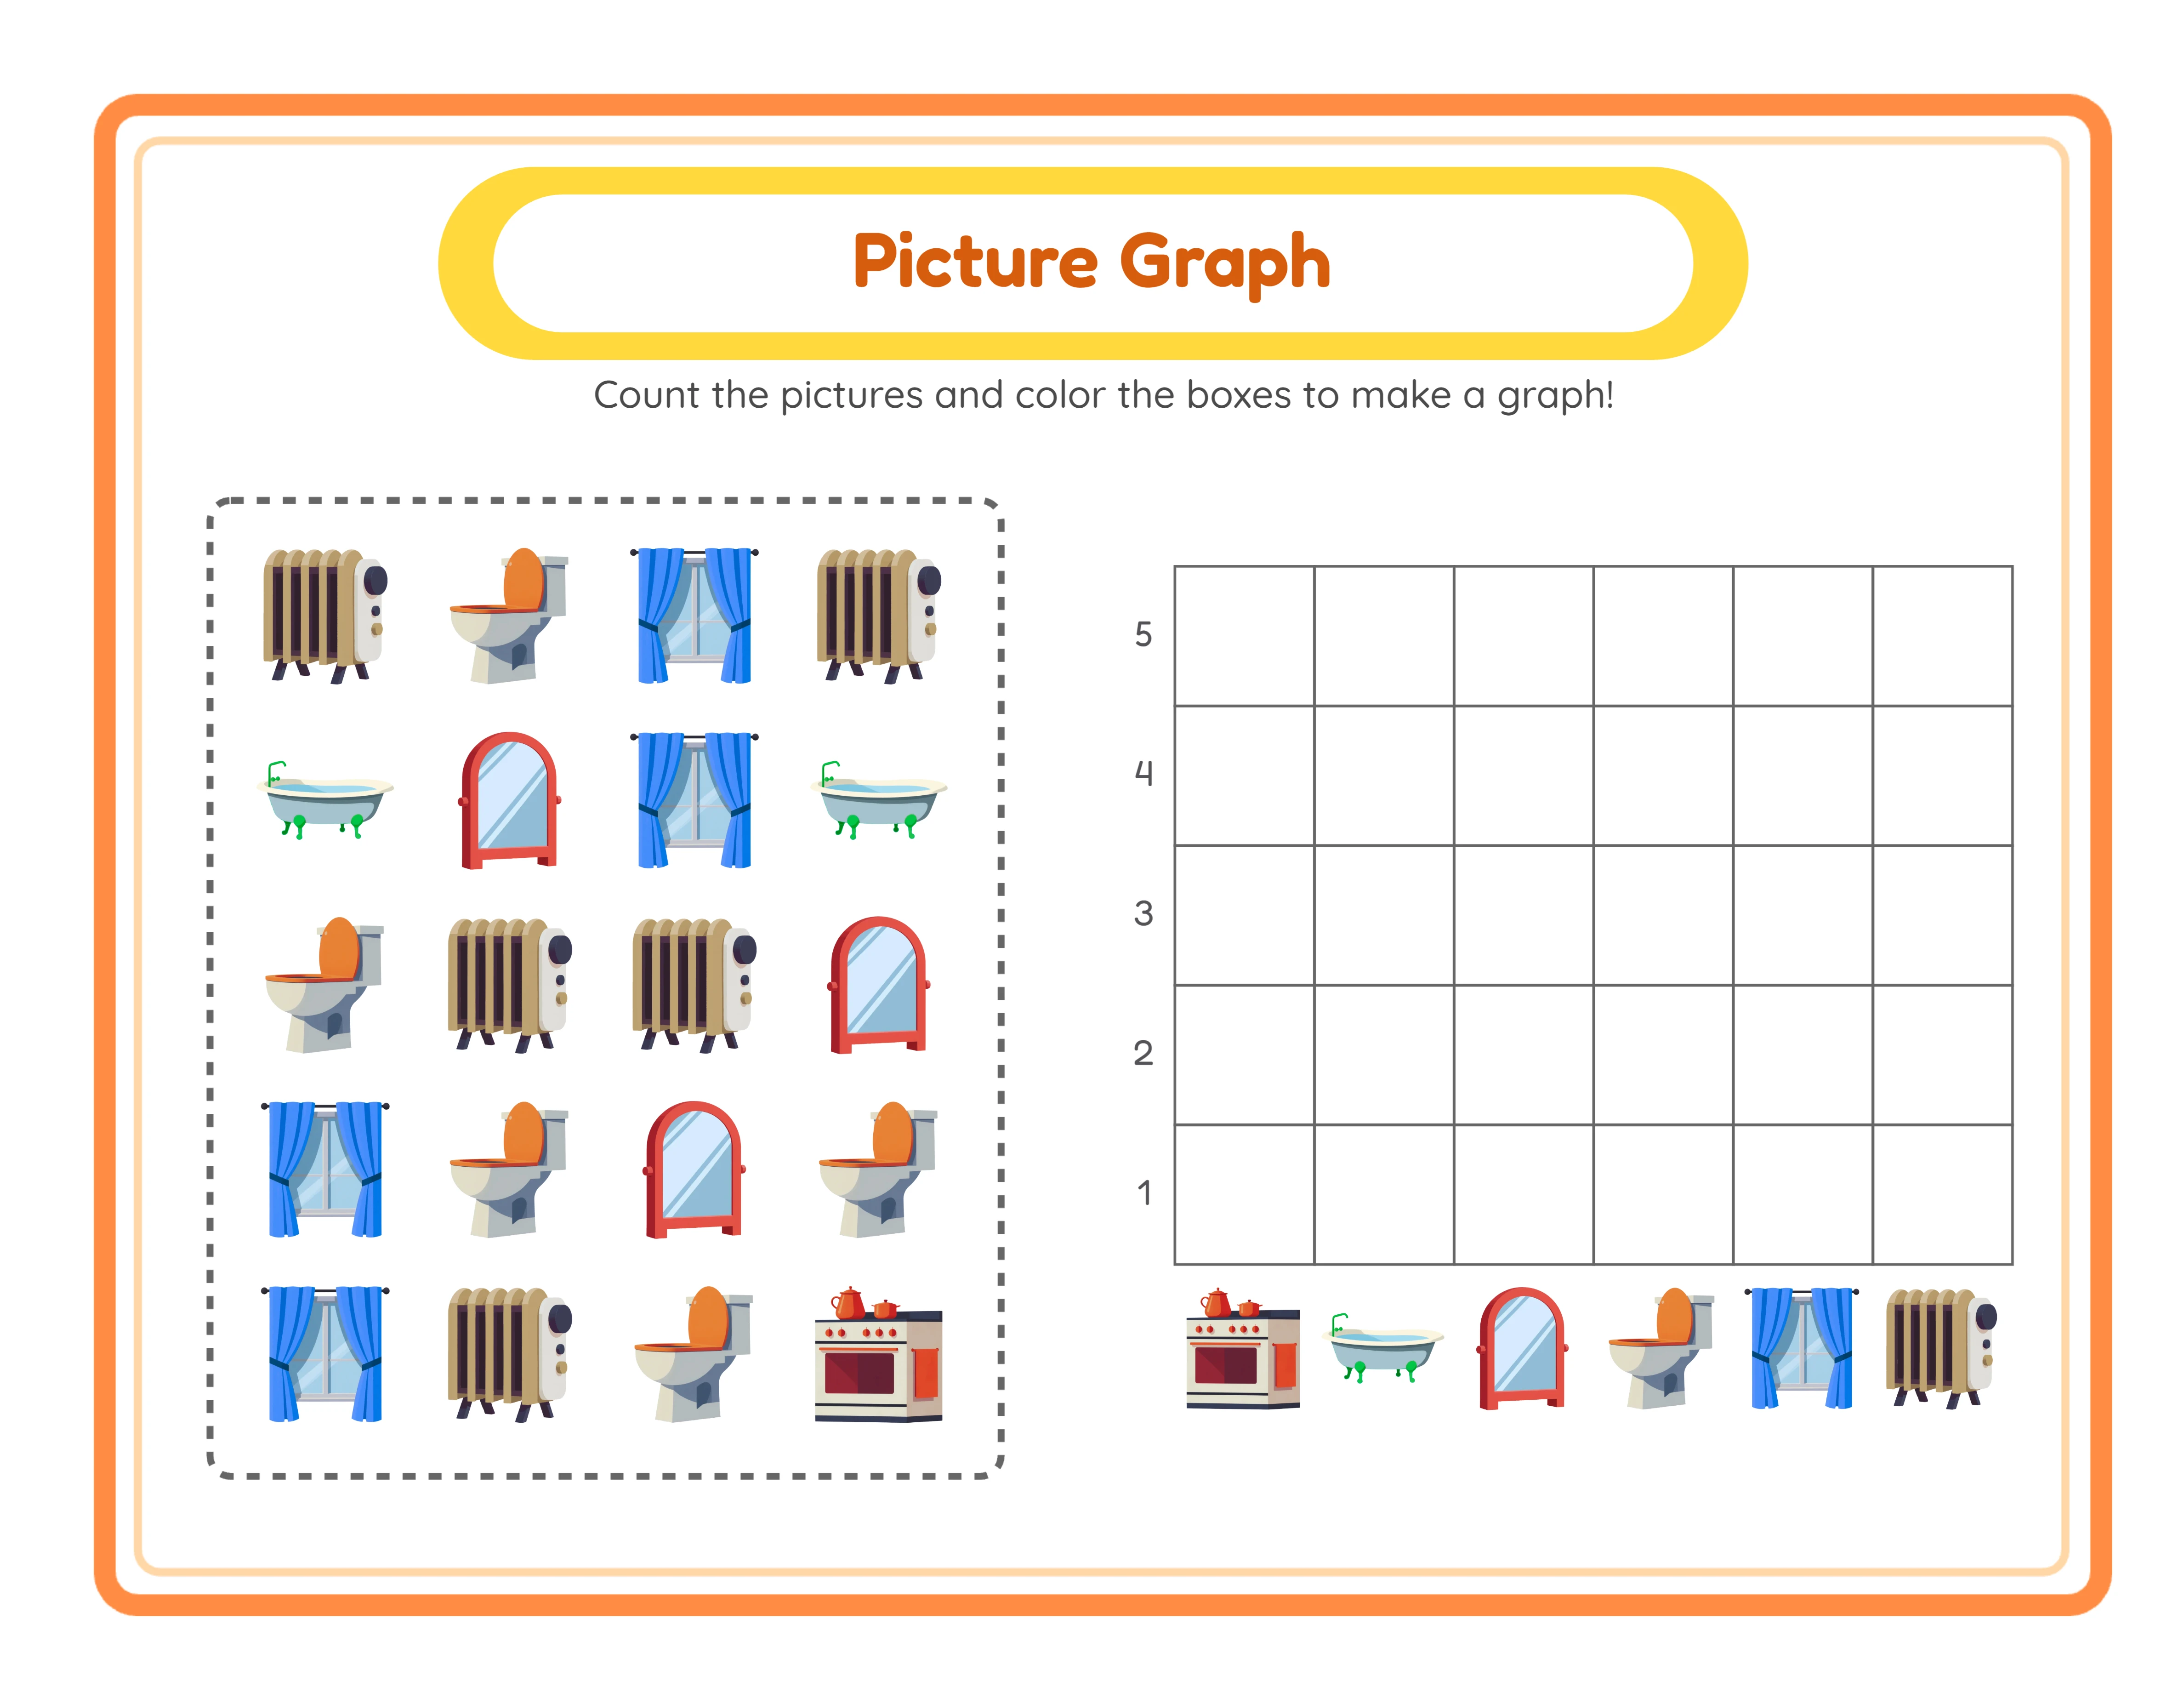
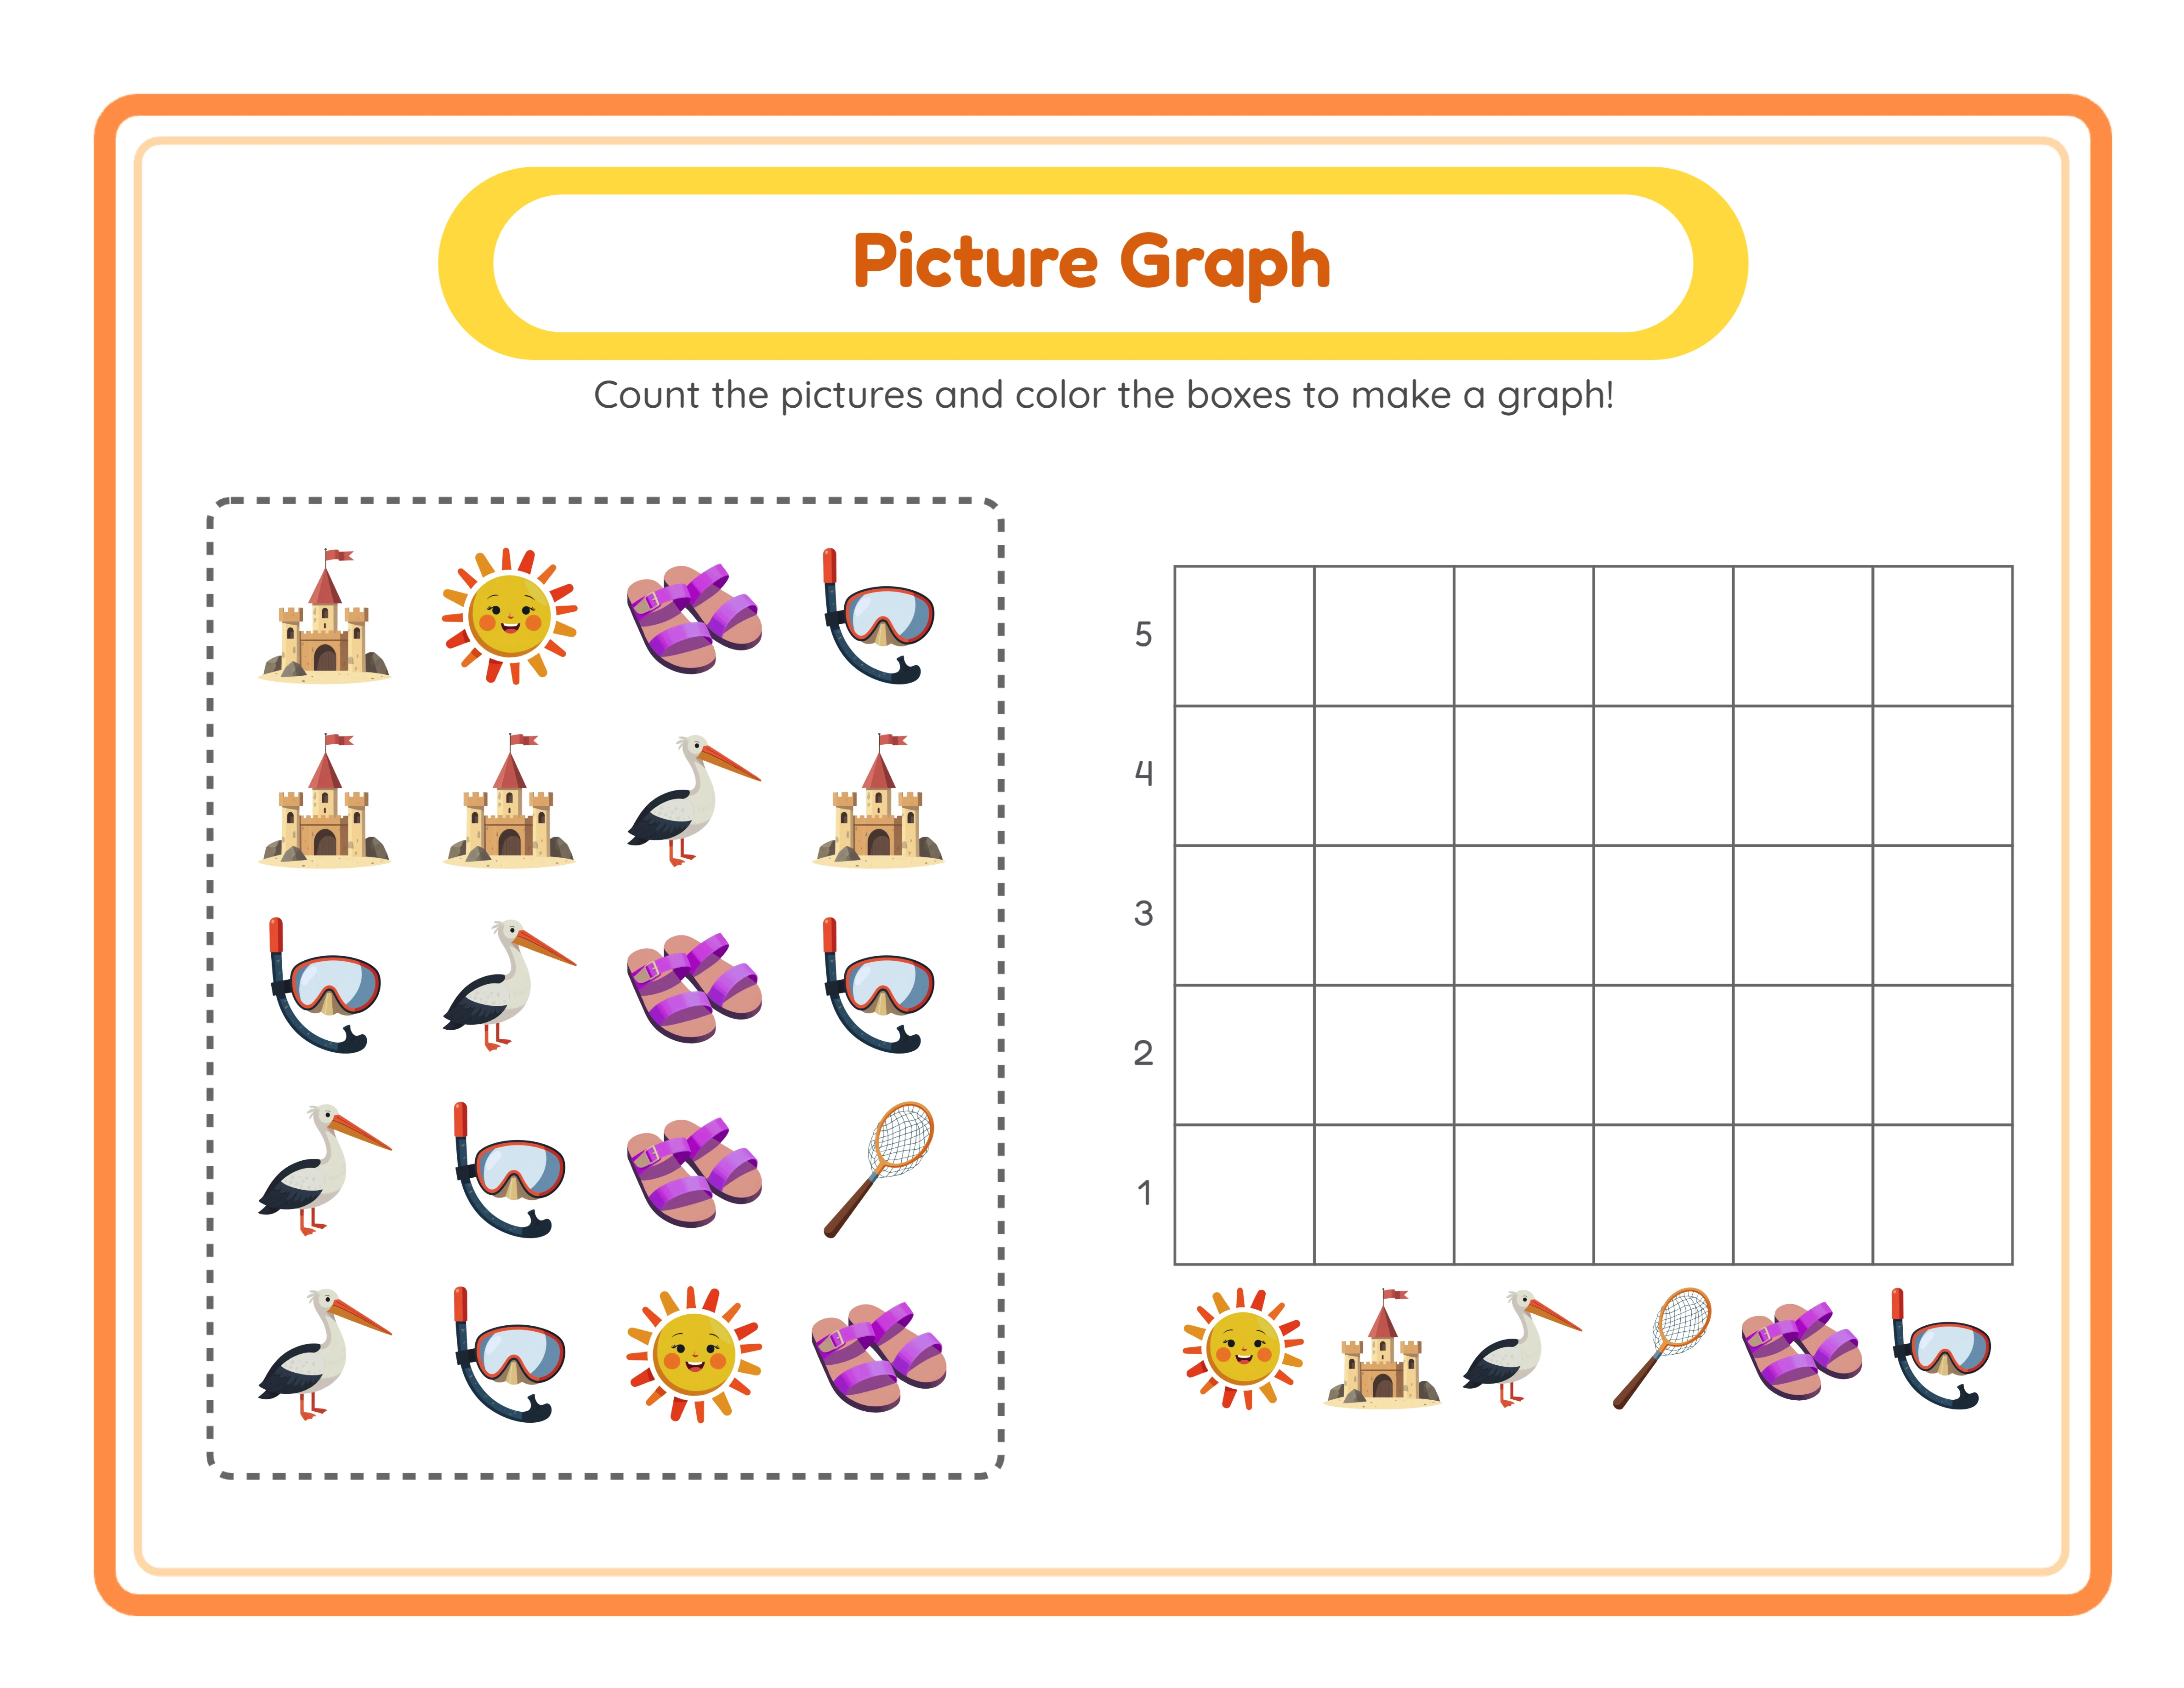
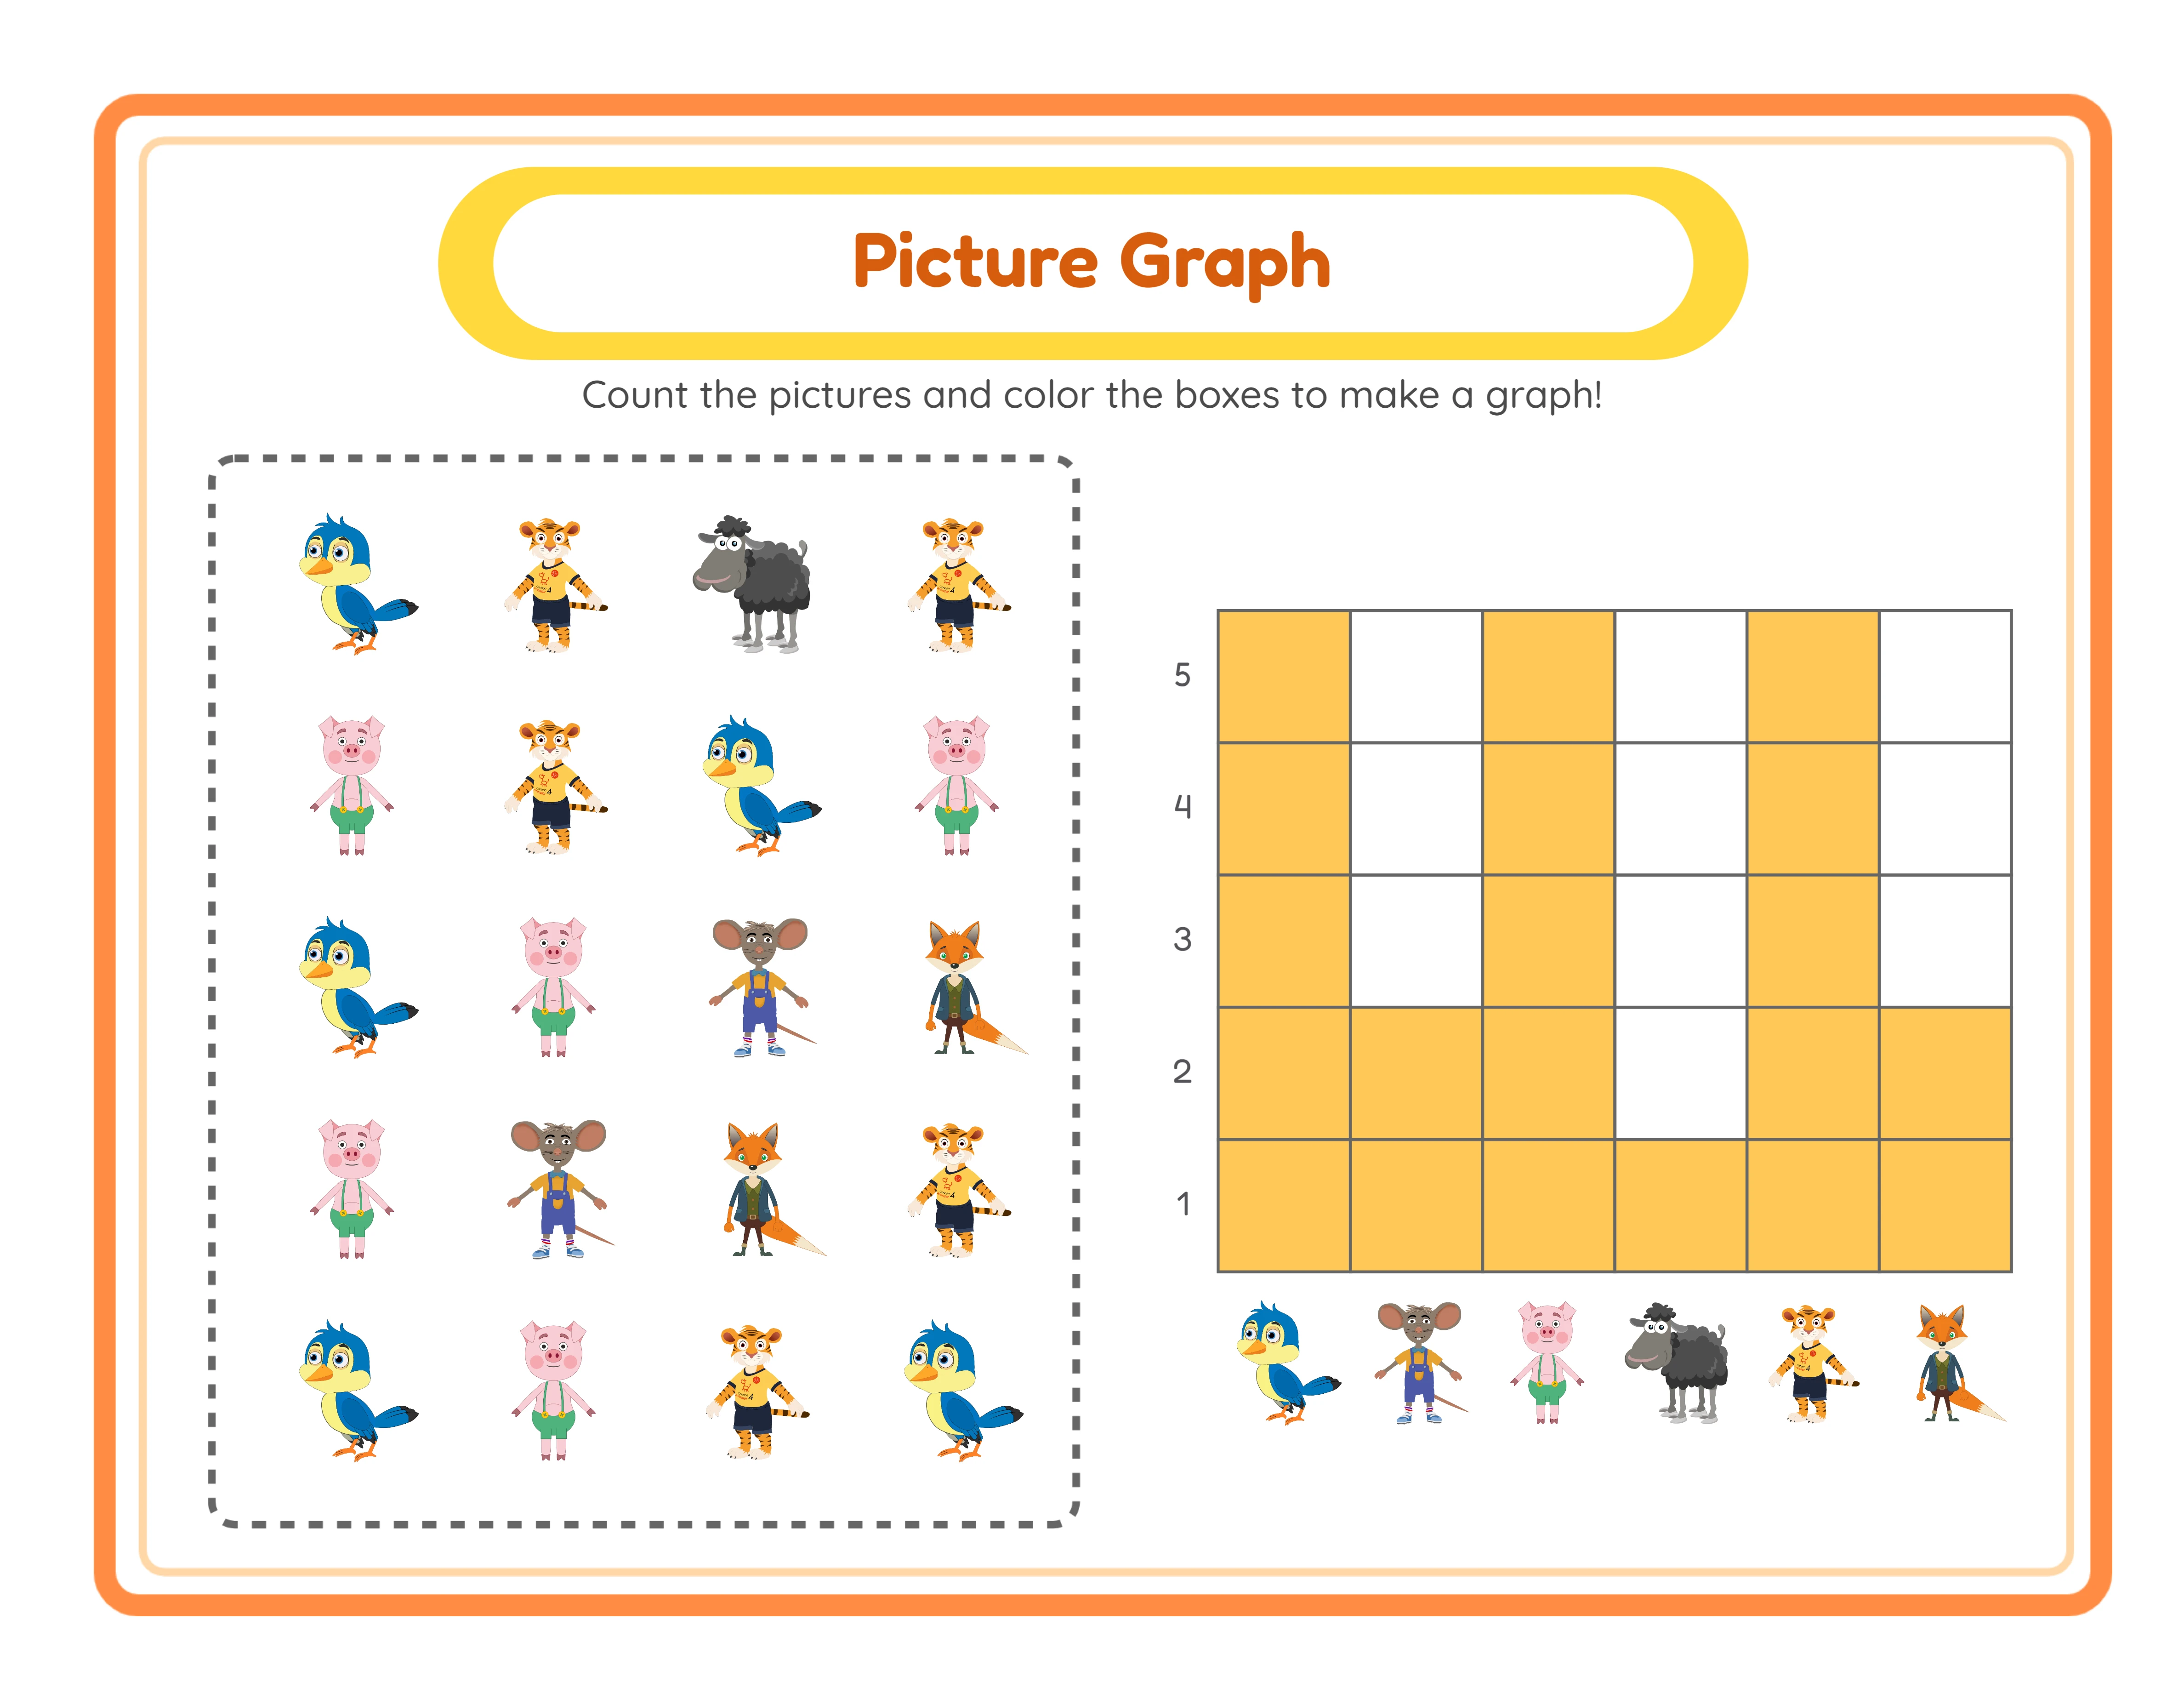
Click Generate to create the worksheet. The app arranges 20 scattered icons from your 6 selected image types in a 4×5 grid with a dashed border at the top of the page. Each type appears 1–5 times in a random distribution, so every generation produces a unique counting challenge even with the same images selected. The scattered arrangement means solvers must visually scan the entire grid and carefully count each image type — a genuine data collection exercise, not a simple reading task.
Below the grid, a 6-column × 5-row bar chart appears with columns labeled by each image type and rows numbered 1–5 from bottom to top. Solvers count how many of each image type appear in the grid, then color or fill the corresponding number of cells in the matching column. This dual structure teaches both data collection (counting scattered images) and data representation (recording counts in a bar chart) in a single activity.
An auto-generated header displays a localized "Picture Graph" title and counting instructions in a styled yellow pill (#FFD93D) with an orange border frame. The header adapts automatically to the active UI language. Click Generate again with the same images to get a completely different random distribution — this is how you build large bundles where every page offers a unique challenge.
5
Review the Auto-Generated Answer Key
Click the Answer Key tab to see the auto-generated solution. The answer key shows the same image grid and bar chart, but the correct cells in the bar chart are filled with yellow (#FFC857) highlighting showing exactly how many of each image type appear in the grid. Buyers see at a glance which cells solvers should have filled, making grading instant and error-proof.
Switch between the Worksheet and Answer Key tabs to compare. The answer key generates simultaneously with the worksheet — no manual counting, no separate creation step, no possibility of error. This simultaneous generation is the primary competitive advantage for sellers building large bundles: every worksheet automatically comes with a verified answer key, eliminating the most tedious and error-prone step in worksheet production.
Each tab has its own pair of download buttons, so you can download the worksheet independently from the answer key. Include answer keys with every product listing — buyers specifically search for worksheets with included solutions, and the auto-generated answer key with highlighted cells is a strong visual selling point in marketplace thumbnails.
6
Add Solver Fields and Localized Header
Check the Include Name/Date box to add formatted "Name: ____" and "Date: ____" fields to the worksheet (Fredoka 18px #333). This single checkbox transforms picture graph worksheets from generic printables into structured group activities. Buyers on Gumroad and in group settings specifically search for worksheets with built-in solver identification — this one-click addition takes no extra effort but elevates your products above competitors who sell unformatted worksheets.
The auto-generated header automatically displays the "Picture Graph" title and counting instructions in whichever UI language is active. Switch between English, German, French, Spanish, Portuguese, Italian, Dutch, Swedish, Danish, Norwegian, and Finnish to see the header update instantly. This localized header makes worksheets group-ready in any locale without manual text editing — particularly valuable for bilingual groups and international schools.
Note that the header is the only language-dependent element. The worksheet content itself — the scattered image grid and bar chart with numbers 1–5 — is universal. Solvers in any country count the same images and fill the same numbered cells. The localized header simply adds appropriate instructional context in the local language.
7
Customize with Text Tools and Canvas Editing
Use the Text Tools panel to add titles, labels, or custom instructions with 7 font choices: Lexend Deca, Baloo 2, Nunito, Quicksand, Fredoka, Arial, and Verdana. Lexend Deca offers clean readability for all ages. Baloo 2 and Fredoka provide playful rounded styles for early childhood materials. Arial and Verdana deliver familiar, universally available sans-serif options. Adjust text outline width from 0 to 10 with 0.5-step granularity for readable headings over decorative backgrounds.
The Fabric.js canvas gives you professional layout control over every element. Drag, resize, and rotate any element on the canvas. Use alignment tools plus center-on-page to position elements precisely. Lock finished elements to prevent accidental movement while adjusting others. The layer system controls which elements appear in front of or behind others. Zoom from 25% to 300% for precision placement on detailed areas, then zoom out to review the full worksheet layout. Undo and redo up to 20 history states with Ctrl+Z and Ctrl+Y, so you can experiment freely without risk.
8
Download All Four Files
Toggle grayscale for ink-friendly black-and-white output ideal for group bulk printing and Amazon KDP interiors. Grayscale picture graphs maintain full functionality because the counting exercise relies on image shape recognition, not color. Creating both color and grayscale versions from the same worksheet doubles your product variants with one click.
Download all four files from a single generation session: worksheet JPEG, worksheet PDF, answer key JPEG, and answer key PDF — all rendered at 300 DPI. Each tab (Worksheet and Answer Key) has its own pair of download buttons. Export in Letter, A4, Square (1200×1200), or custom page sizes. Files are production-ready for Etsy listings, Amazon KDP interiors, and Gumroad resource packs with no post-processing needed.
For marketplace listings, export both PDF (as your deliverable product) and JPEG (for listing preview images and social media promotion). The colorful scattered image grid and structured bar chart format makes visually distinctive thumbnails that stand out against text-heavy worksheet listings. Repeat with different themes from the 104 available collections for rapid product creation — each generation produces a unique worksheet with its own verified answer key.
Important: the free trial with watermark produces fully functional exports with a visible watermark overlay. This lets you evaluate print quality, verify formatting, and create test prints before purchasing a commercial license. The commercial license removes the watermark from all exports, producing clean files ready for sale.
.webp)


.webp)