How to Create Counting and Graphing Worksheets

Counting and graphing worksheets teach two foundational math skills in a single activity: data collection (counting scattered images) and data representation (filling in a bar chart). This dual-skill format is a curriculum standard in early elementary groups worldwide, creating sustained year-round demand across every marketplace. This guide walks you through the entire creation process using the Chart Count Worksheet Maker — from choosing images and generating the scattered grid to reviewing the auto-generated answer key and exporting print-ready files. Whether you are launching your first data skills product or expanding an existing math worksheet catalog, you will have a finished picture graph worksheet with its matching answer key ready to list by the end of this tutorial.
Picture graph worksheet with scattered 4×5 image grid and bar chart for counting and graphing practice
Professional Printables

How to Create Counting and Graphing Worksheets

Create stunning chart count worksheets your customers will love

Chart Count worksheet sample 1
Chart Count worksheet sample 2
Chart Count worksheet sample 3
Picture GraphsAnswer KeysPrint-ReadyFree Trial with Watermark

Introduction

Picture graphs are one of the earliest data representation skills children learn. Starting in kindergarten, solvers practice counting objects and recording their findings in simple charts — a skill reinforced through second grade and beyond. That multi-year curriculum window creates sustained marketplace demand for picture graph and counting worksheets across multiple grade levels. What makes counting and graphing worksheets particularly strong as a printable product is their dual-skill nature. Each worksheet requires solvers to count scattered images (data collection) and then fill in a bar chart (data representation). Buyers value activities that cover two learning objectives simultaneously because they maximize instructional time. Parents and tutors appreciate the visual, hands-on format that makes abstract math concepts concrete. The Chart Count Worksheet Maker handles the technical complexity for you. It generates a 4×5 scattered image grid containing 20 icons from 6 different image types, each appearing 1–5 times in a random distribution that makes every generation unique. Below the grid, a structured 6-column × 5-row bar chart gives solvers a clear place to record their counts. The app simultaneously produces an answer key on a separate canvas tab with yellow-highlighted cells showing the correct counts — no manual counting, no separate creation step. You focus on product strategy — which themes to use, how to bundle, which marketplaces to target — while the generator handles layout, distribution logic, answer key accuracy, and print formatting. Every feature mentioned in this guide is available in the free trial with watermark. You can create sample worksheets, test every configuration, and evaluate output quality before purchasing a commercial license.
Try It Free with Watermark

Try any generator free with watermark. No signup required.

Tutorial

1

Open the Chart Count Worksheet Maker

Navigate to the Chart Count Worksheet Maker and click "Try Free Now" to launch the generator in your browser. The tool loads instantly with a settings sidebar on the left and a dual-tab canvas on the right — one tab for the worksheet, one for the answer key. No account creation, no software download, no installation required. The dual-tab canvas is a distinguishing feature of this generator. Unlike single-canvas worksheet tools, the Chart Count Maker simultaneously produces both a solver worksheet and a buyer answer key in the same session. You will work primarily on the Worksheet tab during creation, then switch to the Answer Key tab to review the auto-generated solution before exporting both. Take a moment to familiarize yourself with the sidebar sections: Page Setup for dimensions and decorations, Image Library for selecting your 6 image types, and Text Tools for adding custom titles and instructions. The canvas area supports full drag-and-drop editing with zoom controls ranging from 25% to 300%.
2

Set Page Layout and Background

In the Page Setup section, select your page size. Options include Letter Portrait, Letter Landscape, A4 Portrait, A4 Landscape, Square (1200×1200), and custom dimensions. US Letter is the standard for North American buyers, while A4 serves European and international markets. Creating both versions doubles your market reach with minimal additional effort. Set a page background color — white is the default for clean, print-friendly worksheets. For digital-use products or premium bundles, a light pastel can add visual warmth. The generator offers both background themes and border themes from the built-in library, each controlled by an independent opacity slider (0–1, step 0.05). Set a subtle watercolor background at 15–25% opacity to add texture without distracting from the image grid and bar chart. Layer a decorative border at 80–100% opacity for a polished frame. Background and border themes work independently, so you can mix and match to create a professional product look. Consistent styling across a bundle creates a cohesive brand identity that buyers recognize and return to.
3

Choose Your Image Source

The Chart Count Maker offers two distinct workflows for selecting the 6 image types that will appear on your worksheet. Automatic mode: Use the Worksheet Image Source dropdown to select a theme like Animals, Food, or Vehicles. The app randomly picks 6 images from that collection. This is the fastest workflow for building large bundles — select a theme, generate, repeat. With 104 themed collections containing 3,100+ illustrations, you have enormous variety without any manual selection. Manual mode: Browse the Image Library by theme or search by keyword, then click exactly 6 images. Selected images appear in a preview strip where you can click to remove and replace individual picks. Manual selection gives you precise control over which image types appear together — useful for creating curriculum-aligned worksheets where specific items matter (farm animals only, ocean creatures only, or specific food groups). You can also upload custom PNG, JPG, or GIF images using the upload button for subject-specific picture graphs, branded content, or niche themes not covered by the built-in library. Both modes guarantee exactly 6 image types per worksheet, which is essential for the 6-column bar chart format. The strategic choice between automatic and manual depends on your product: automatic for rapid bundle creation, manual for curated educational products.
4

Generate the Picture Graph Worksheet

Click Generate to create your worksheet. The app performs several operations simultaneously: 
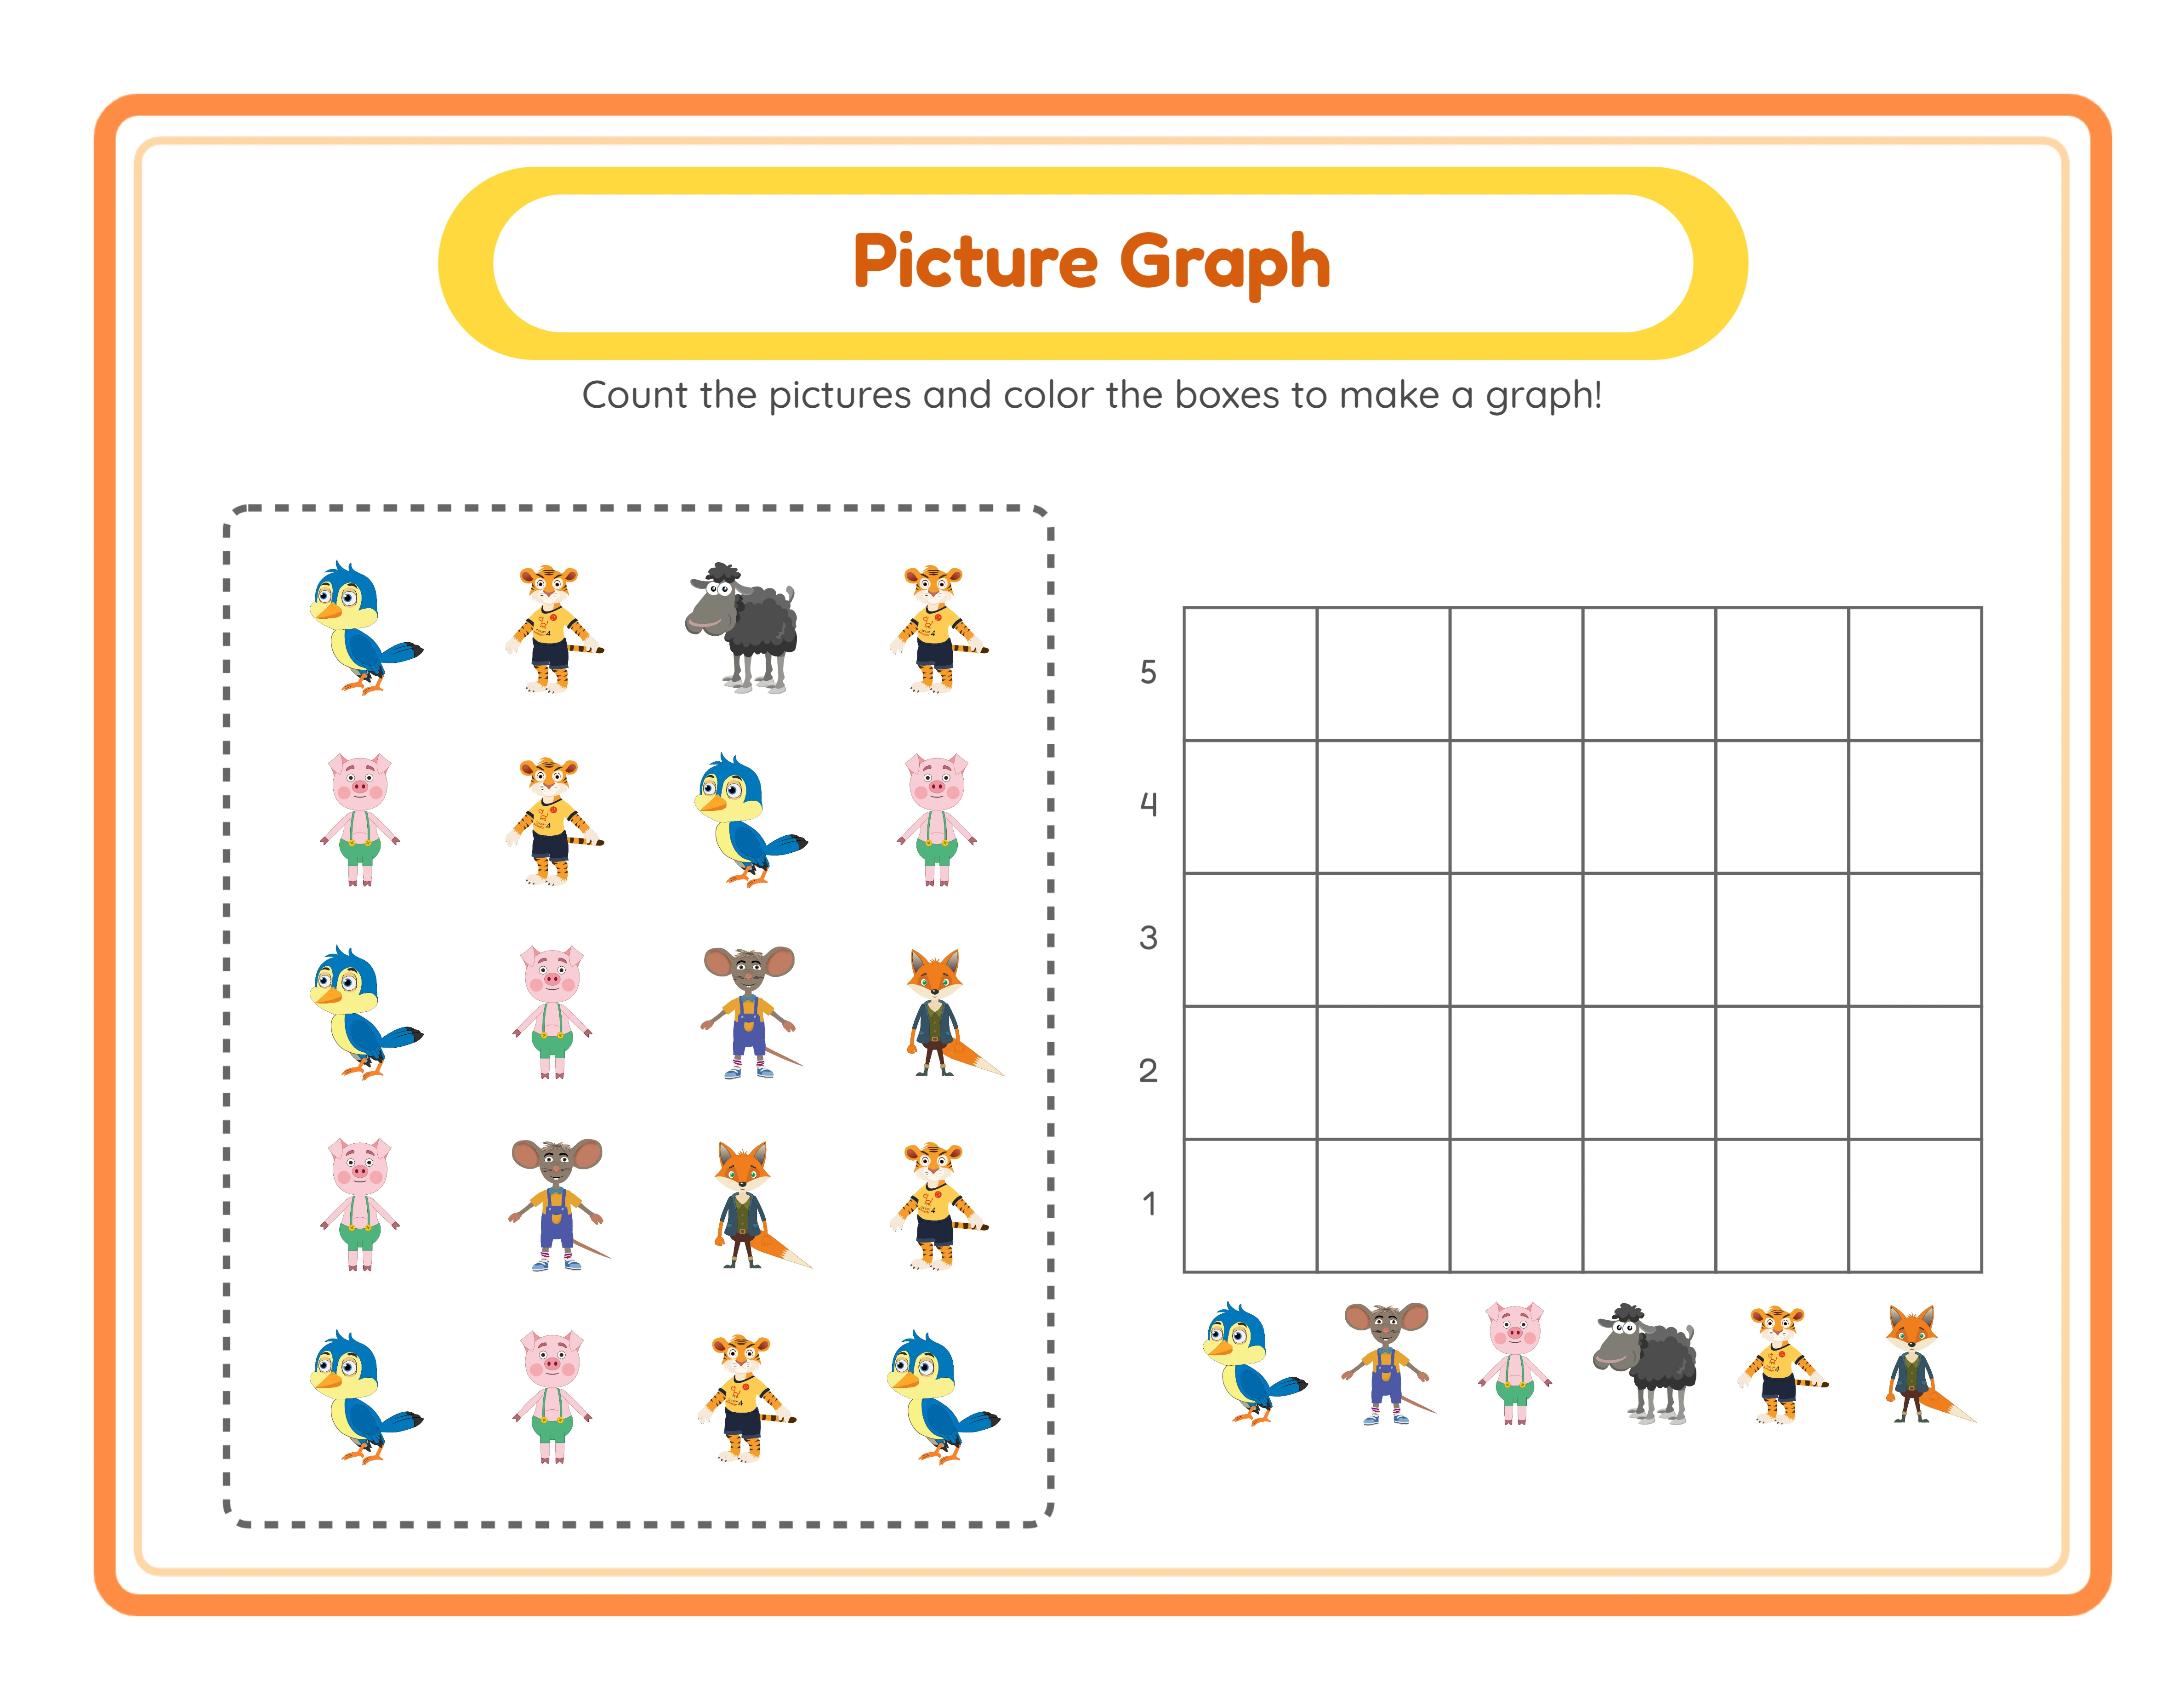
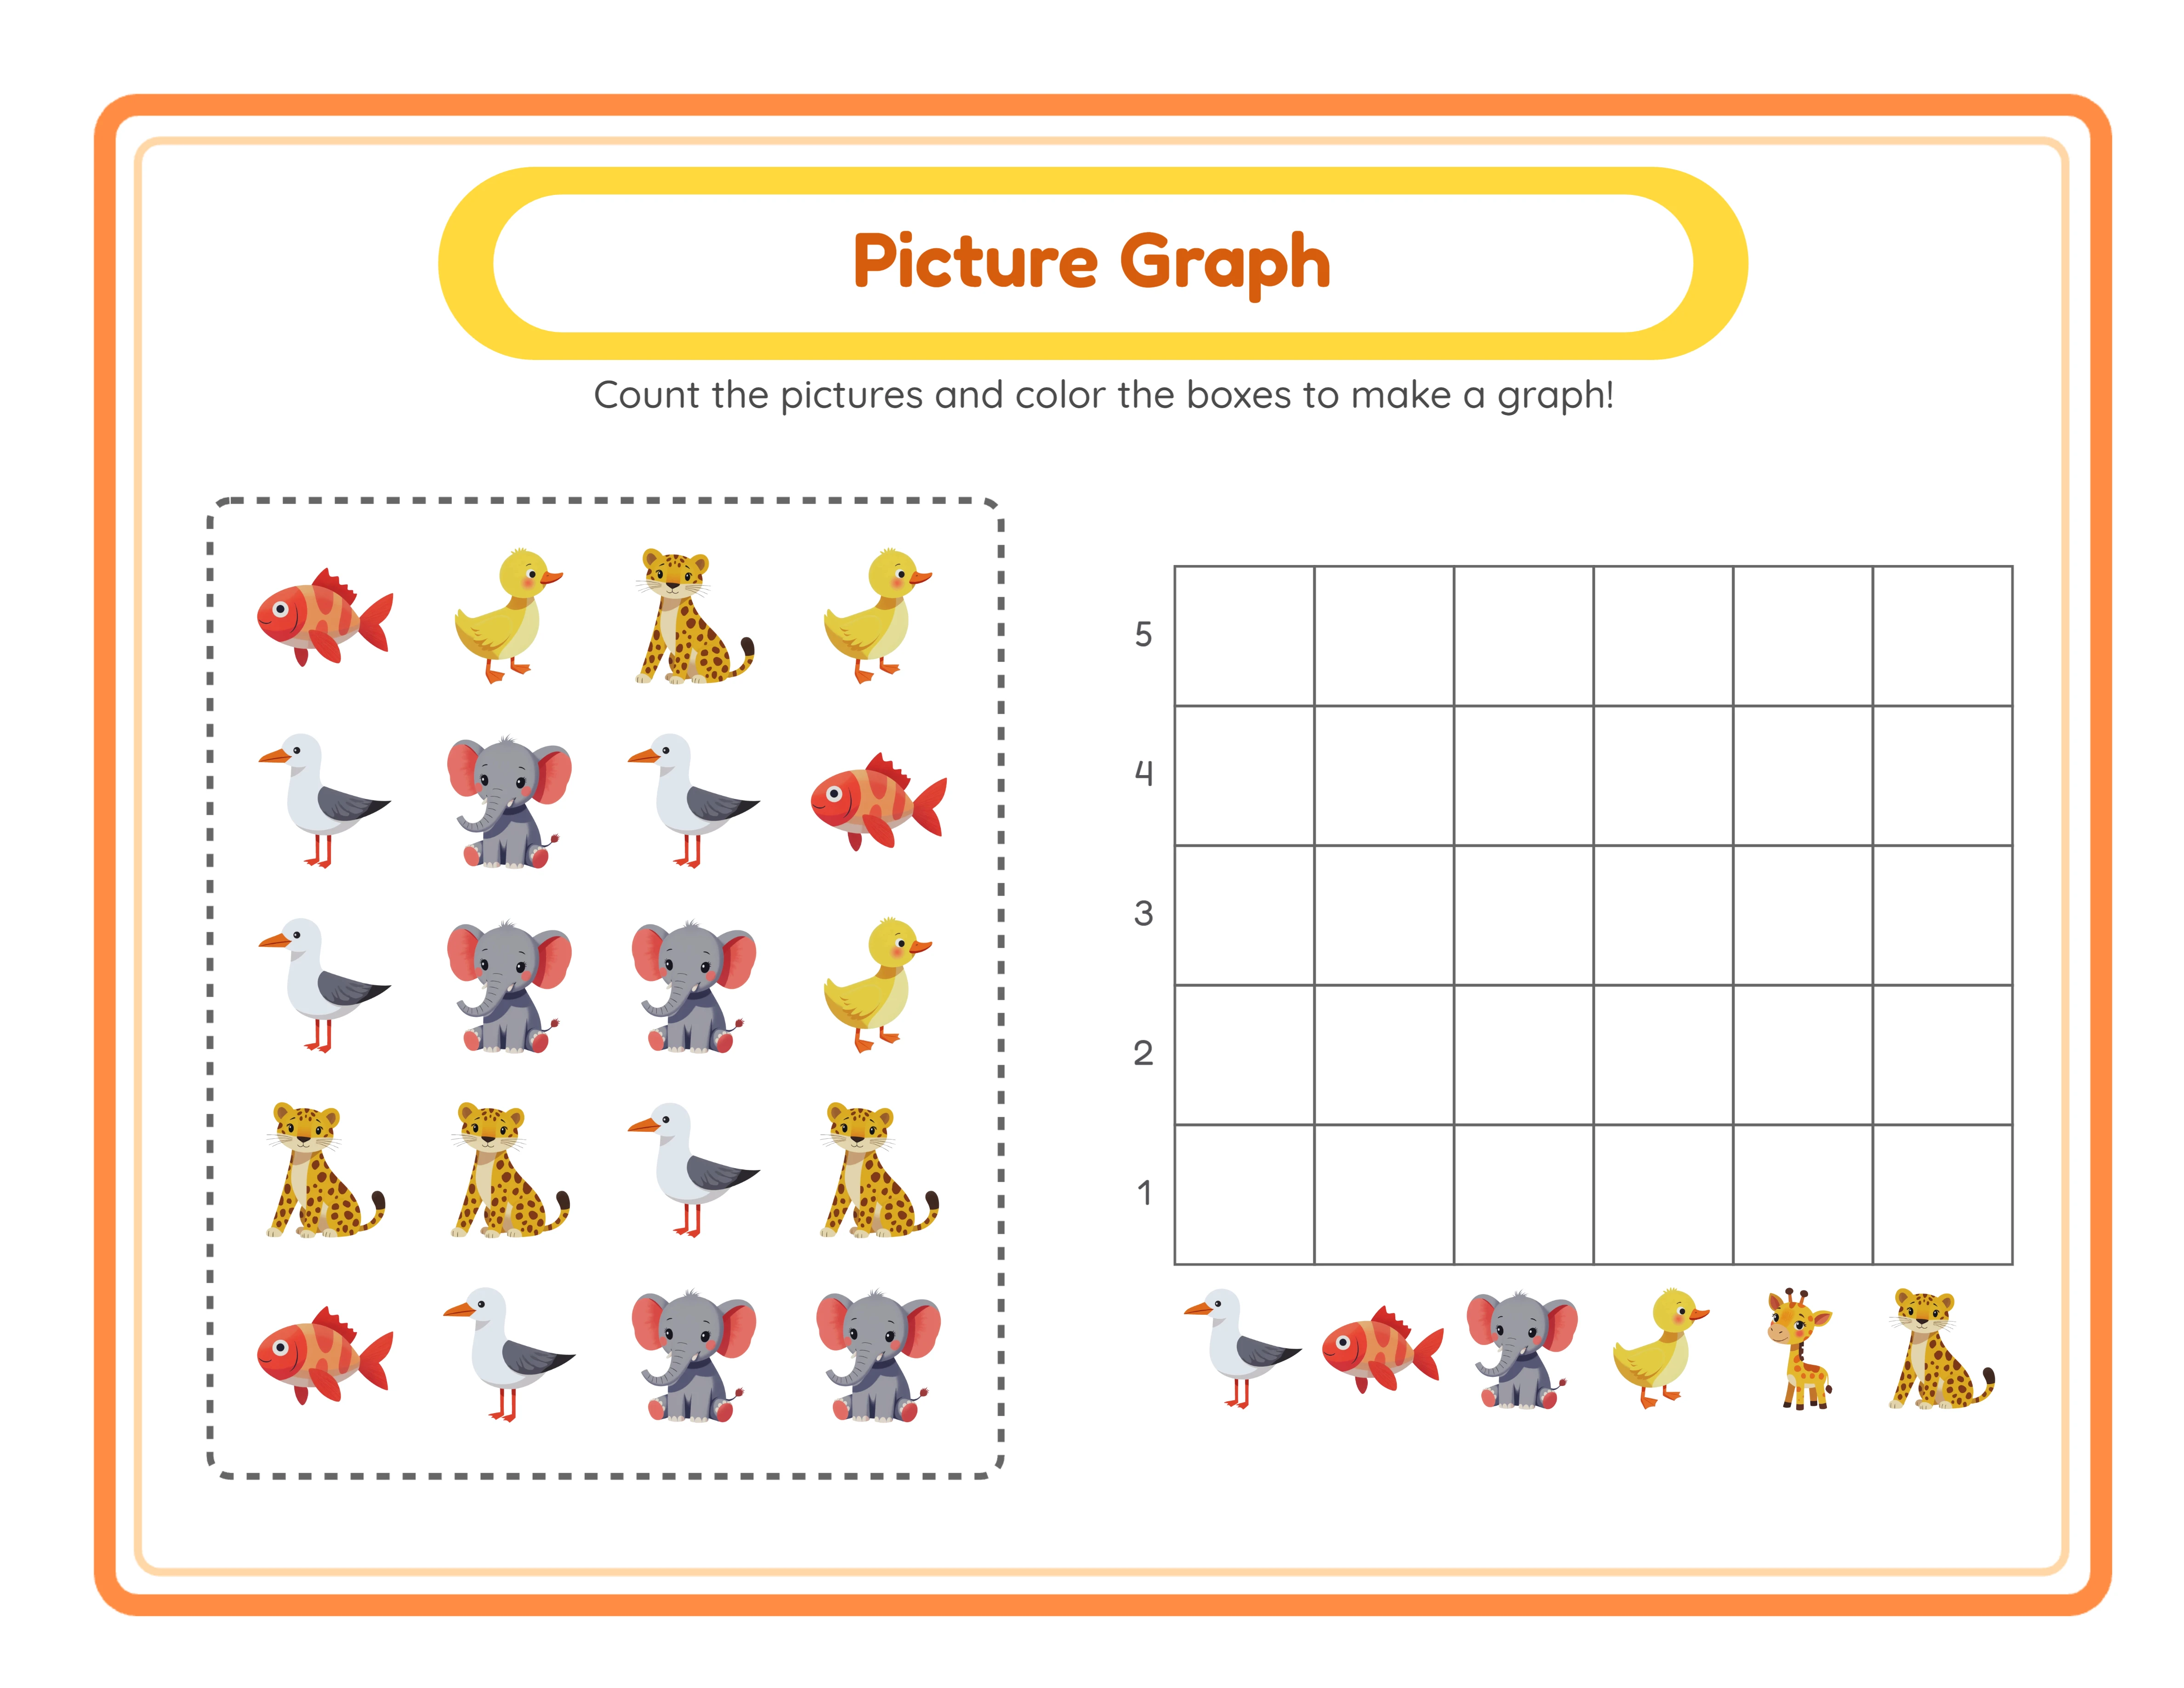
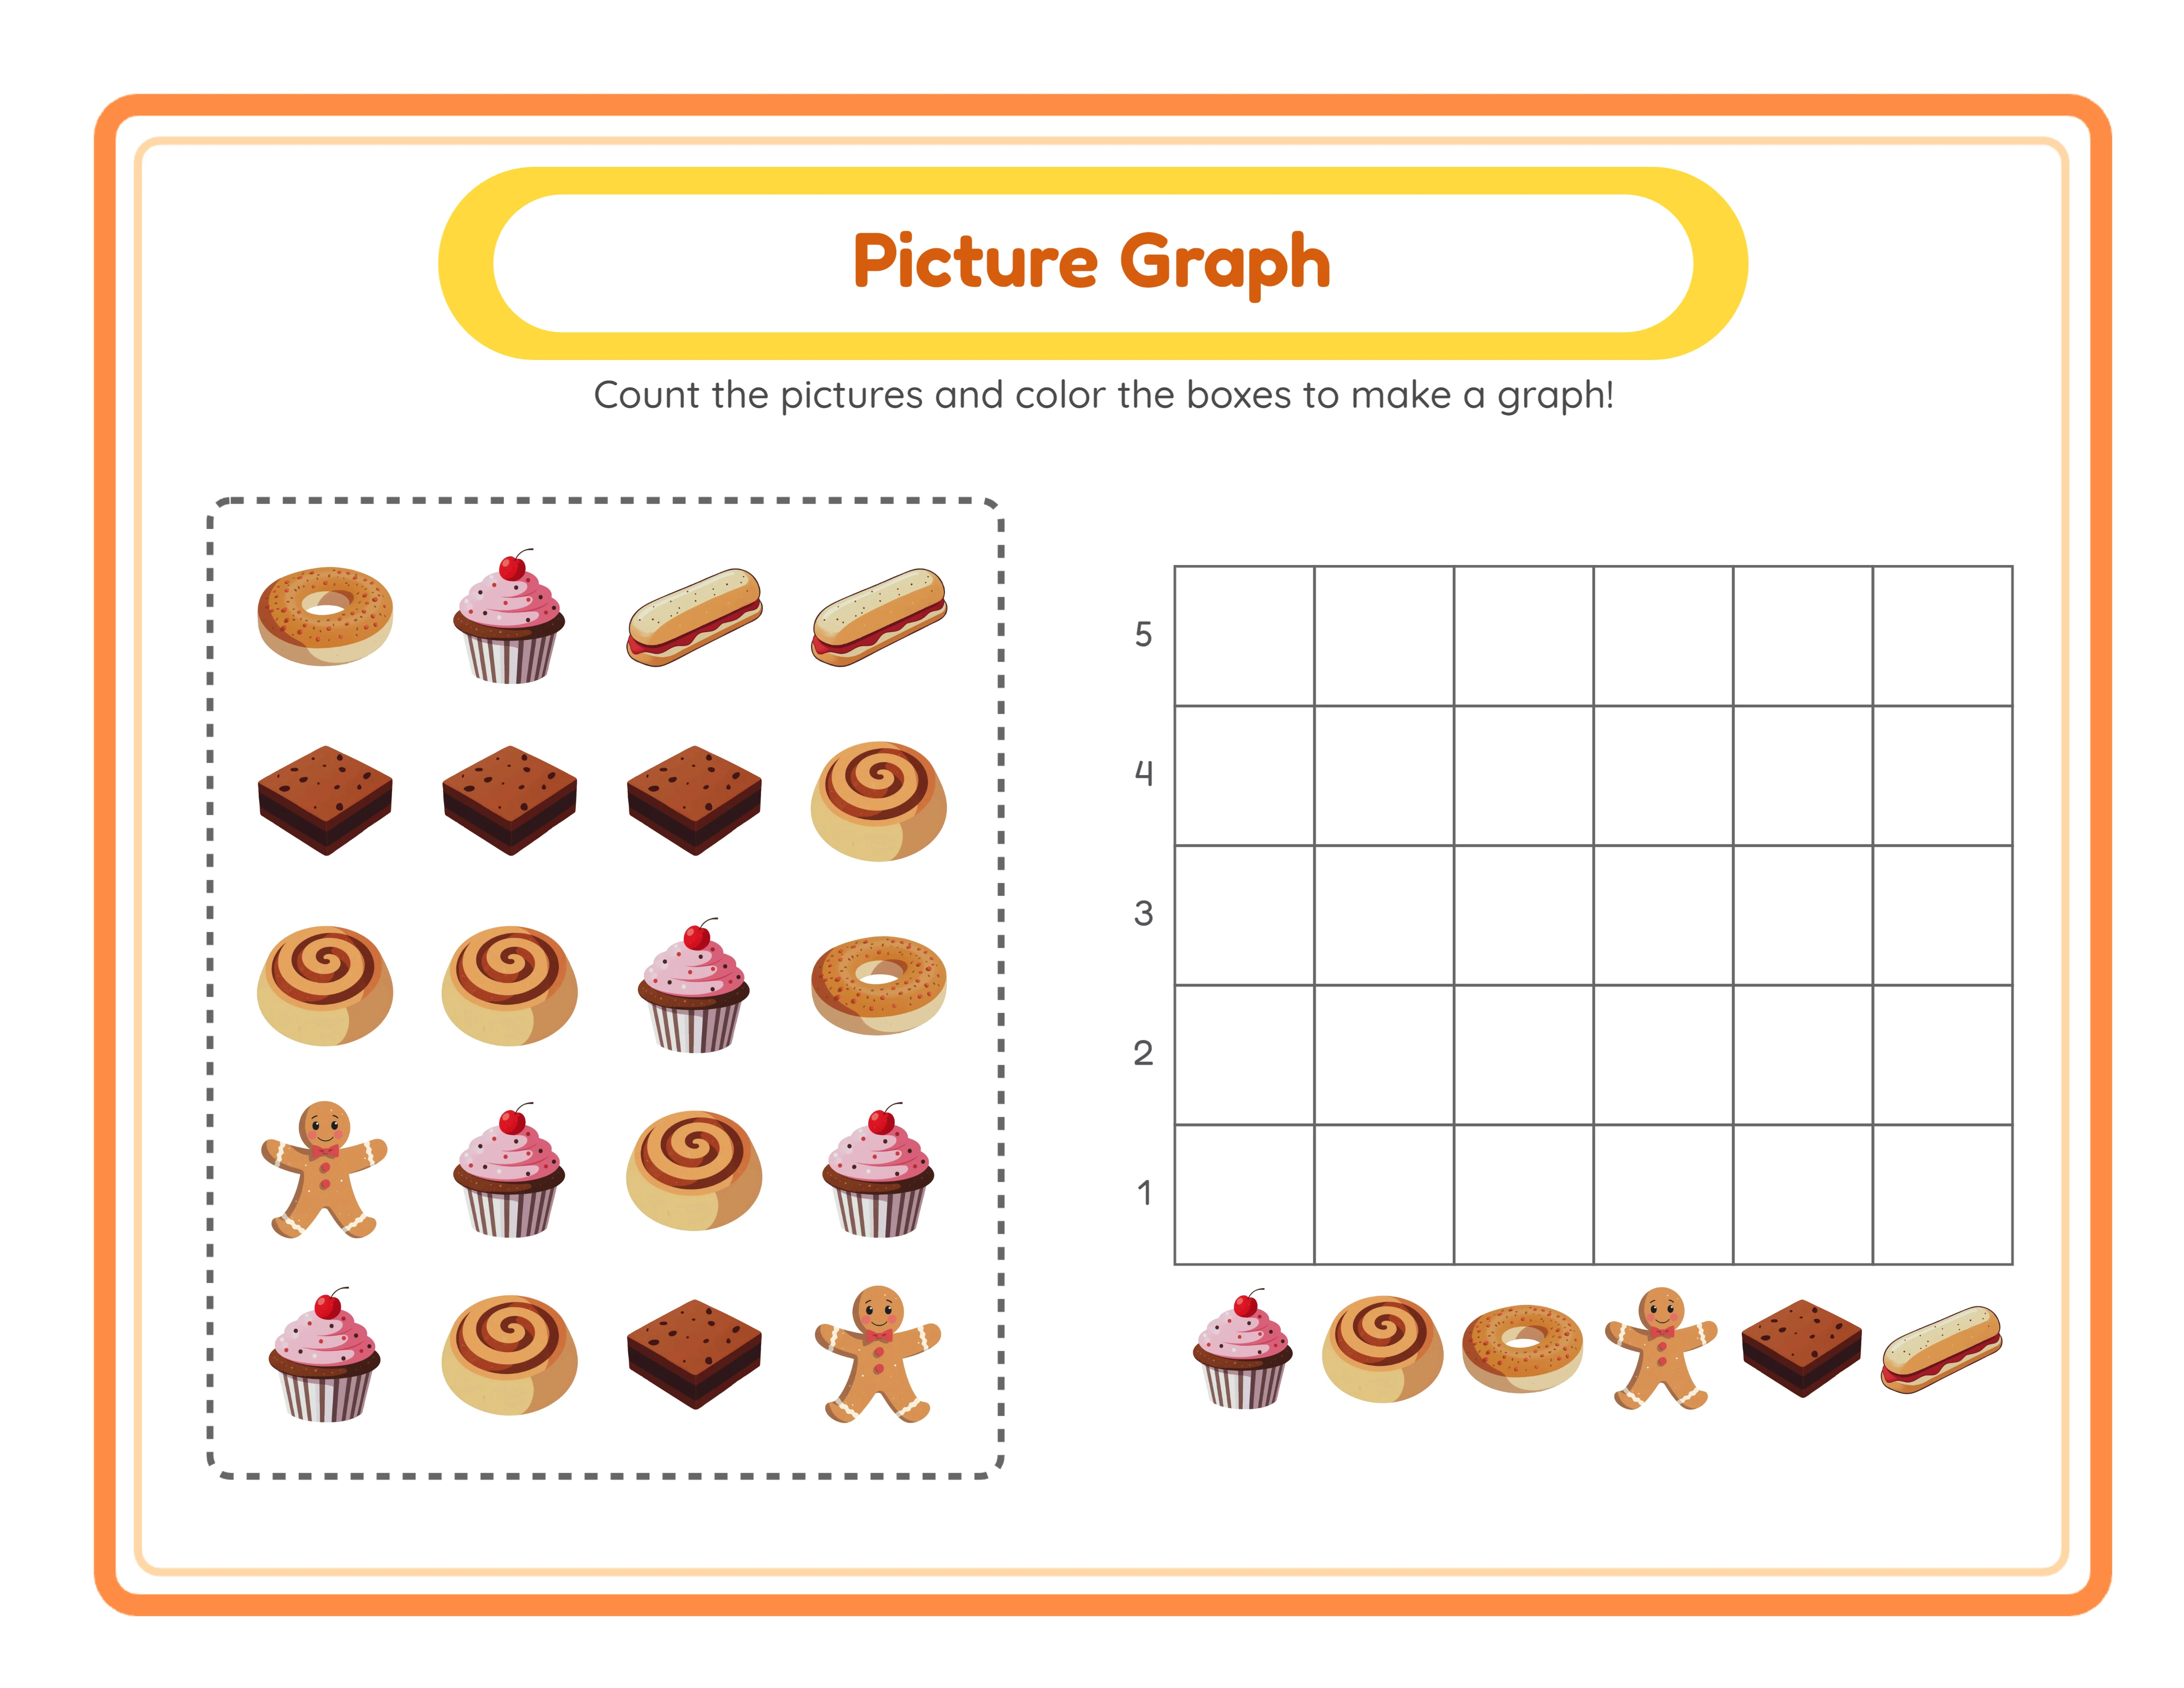
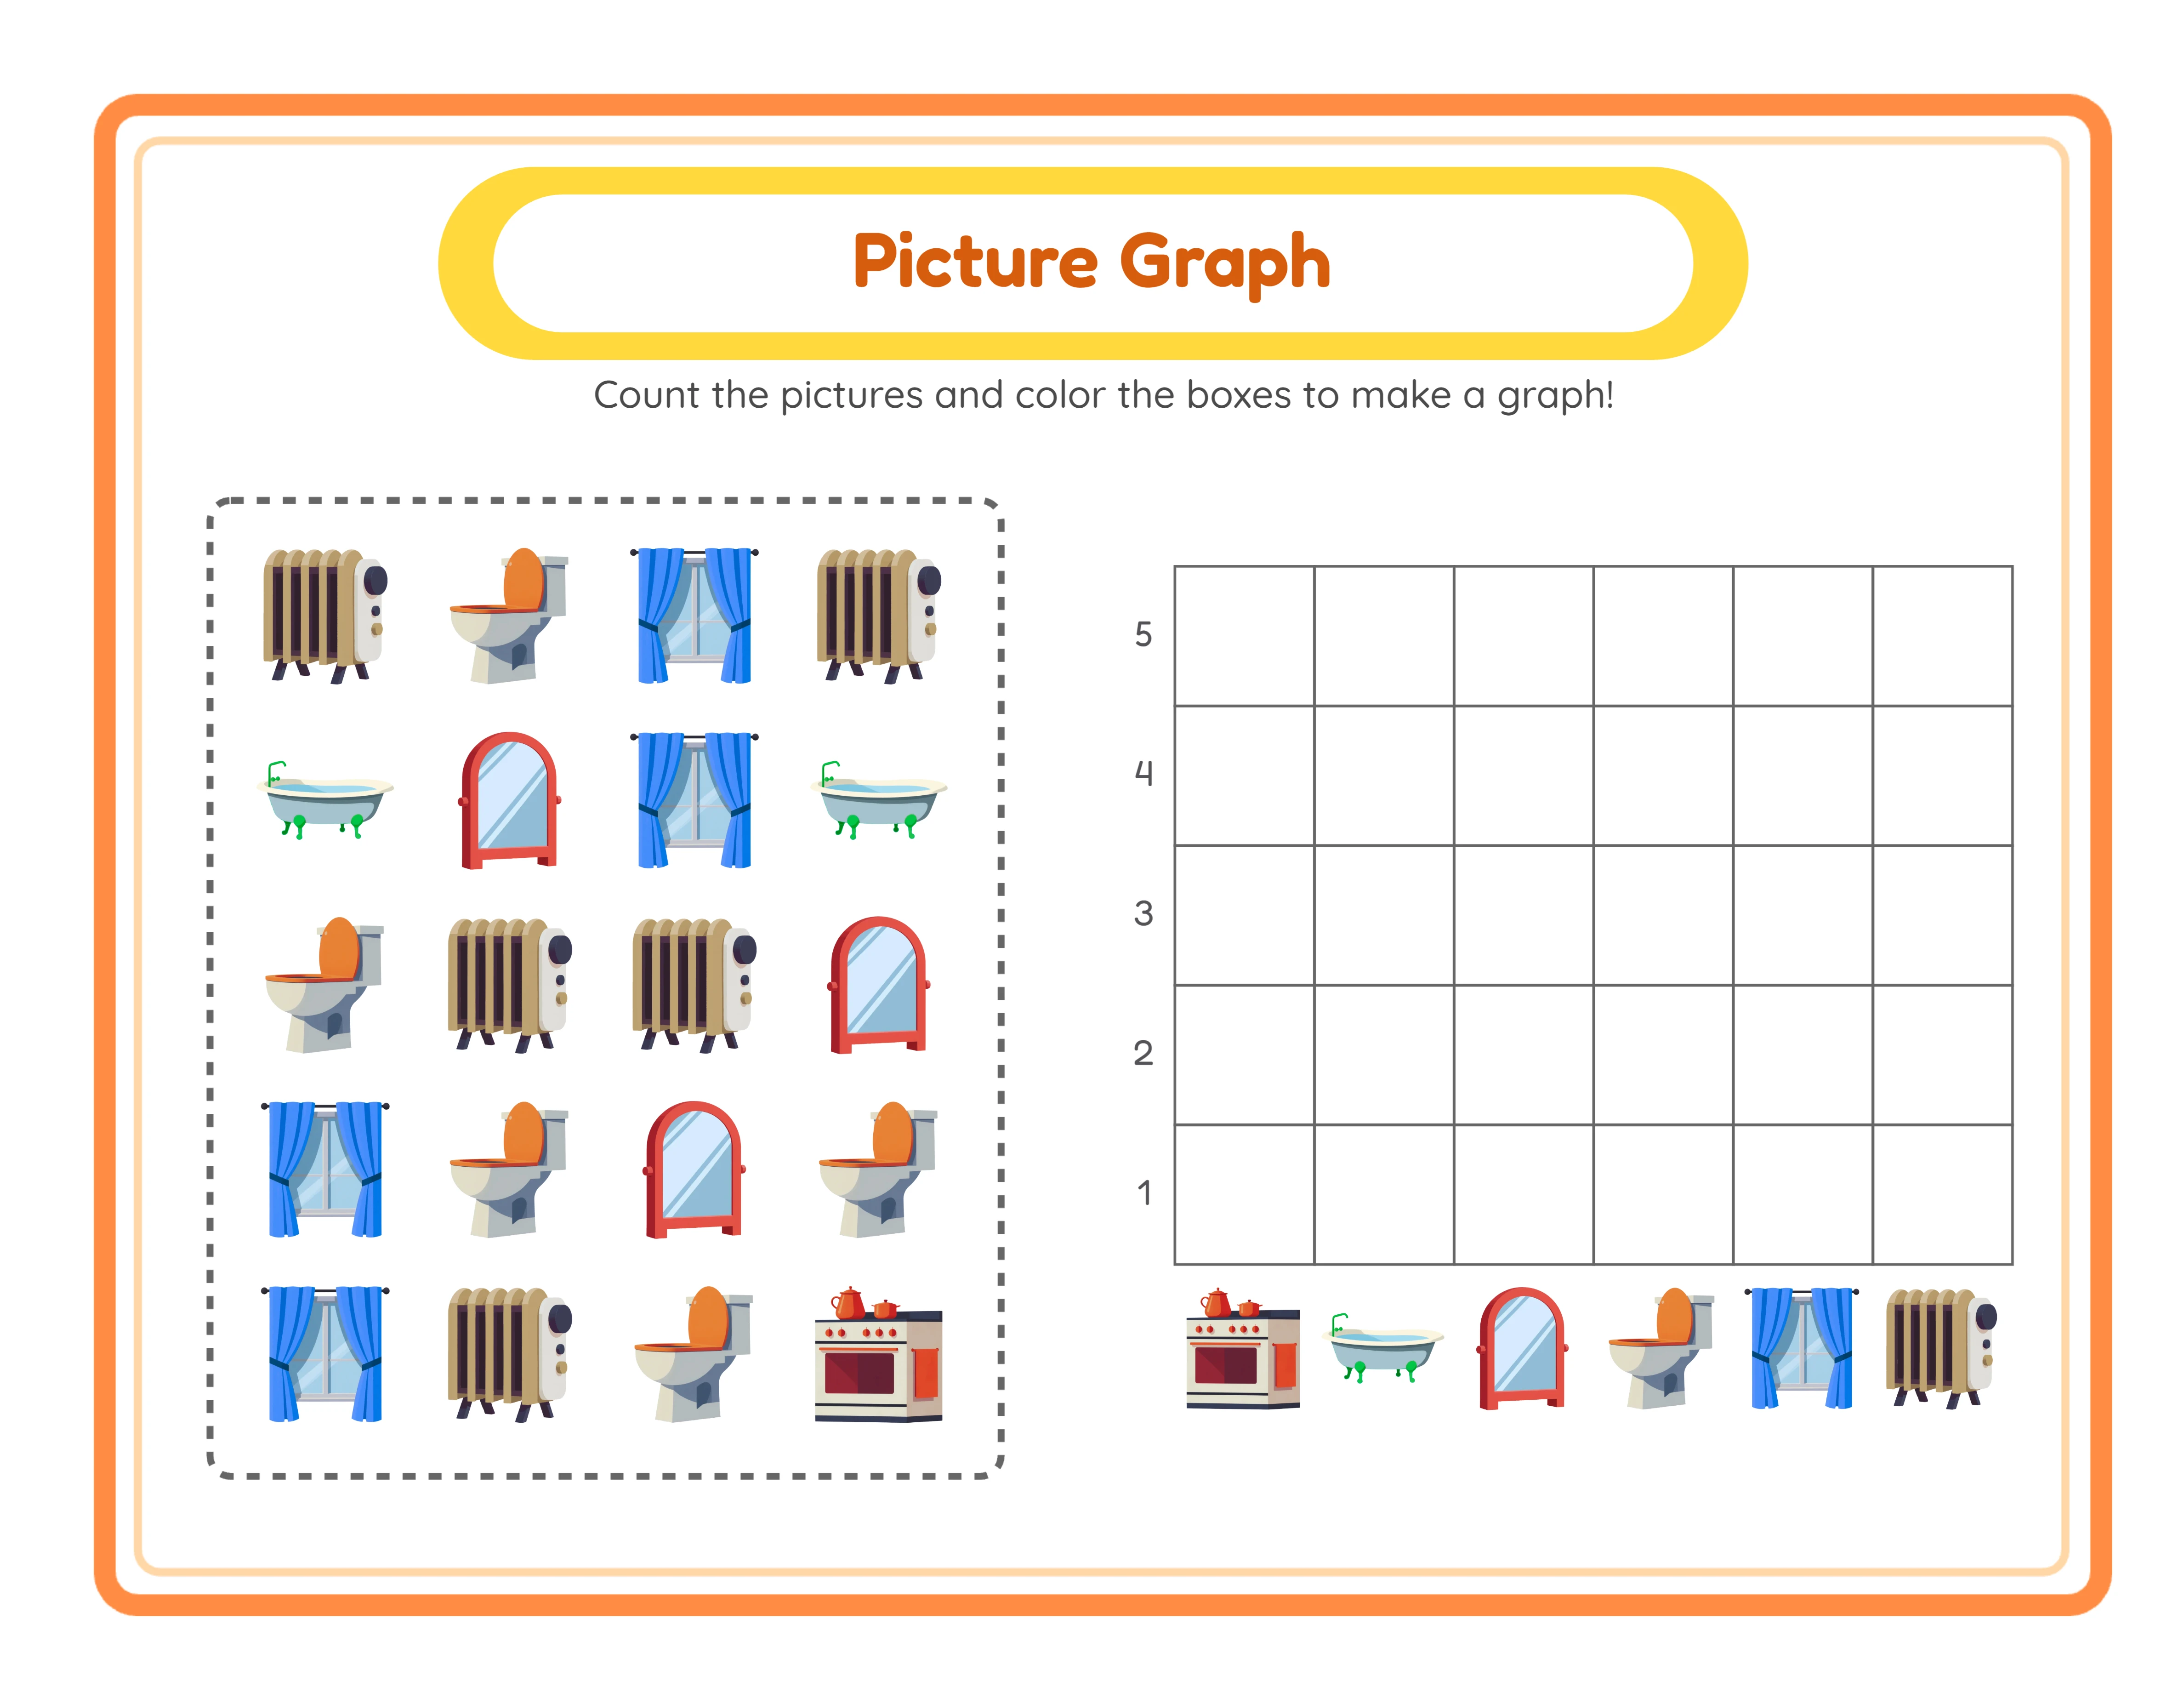
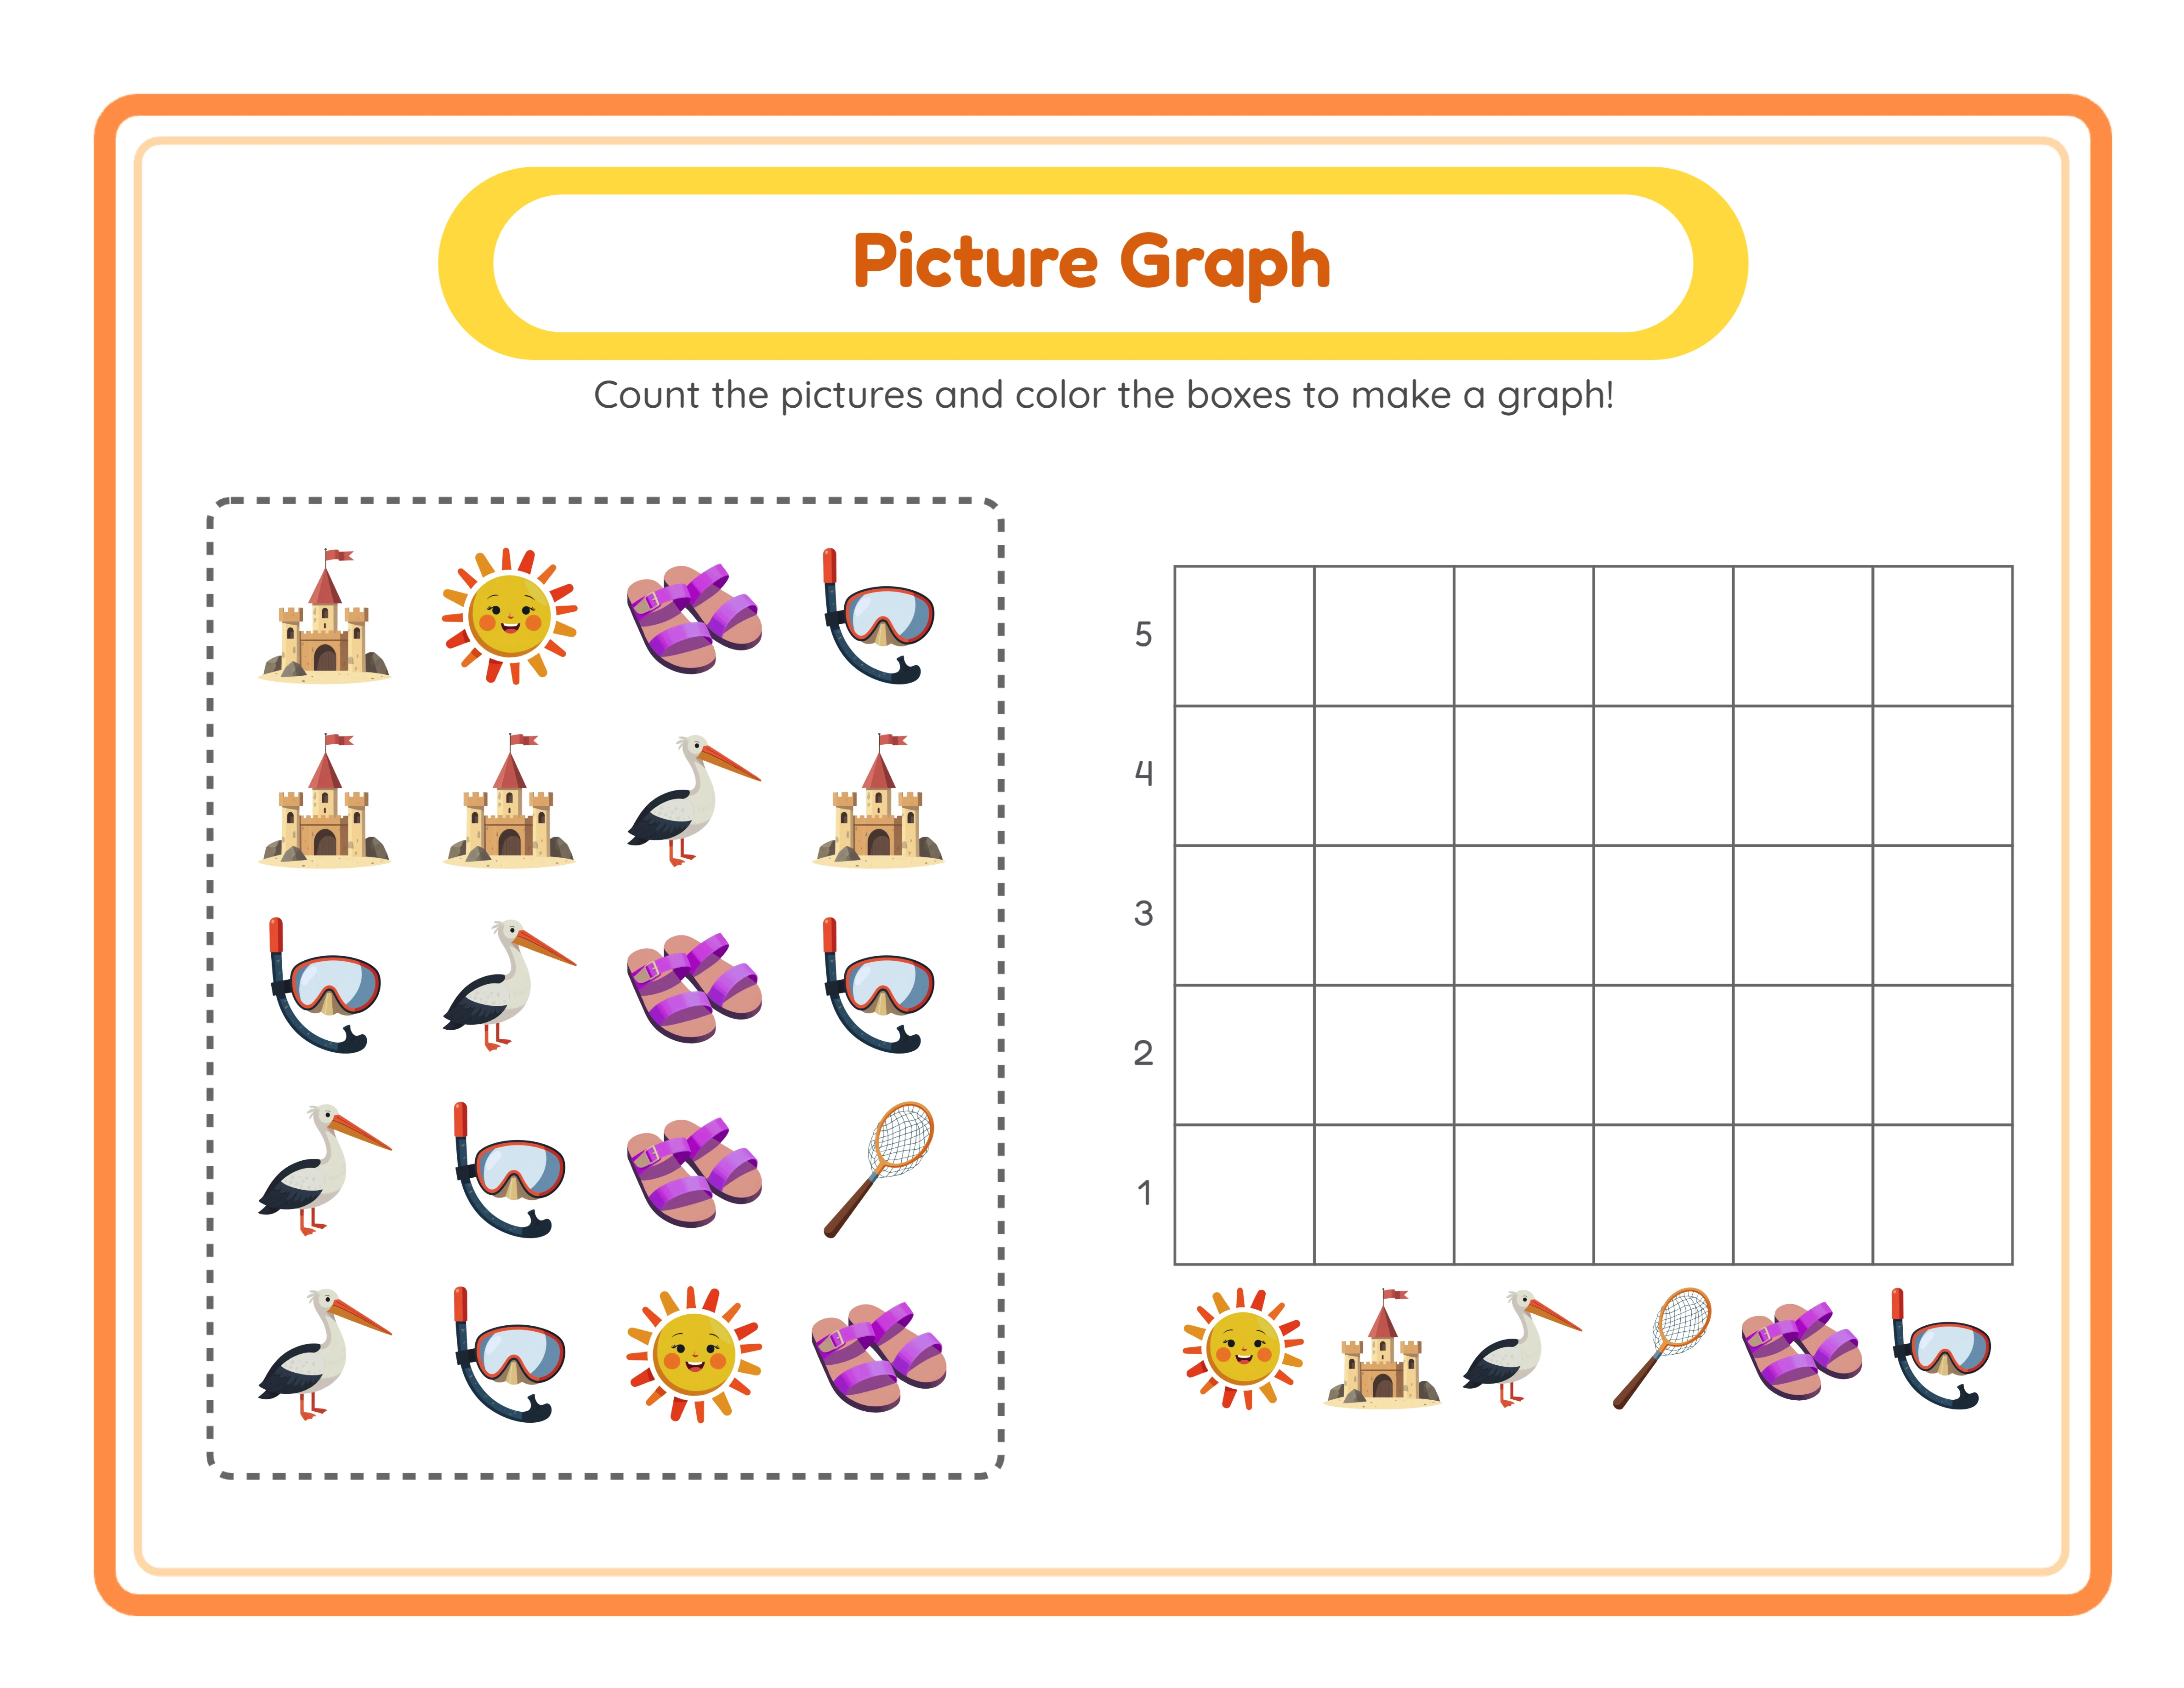
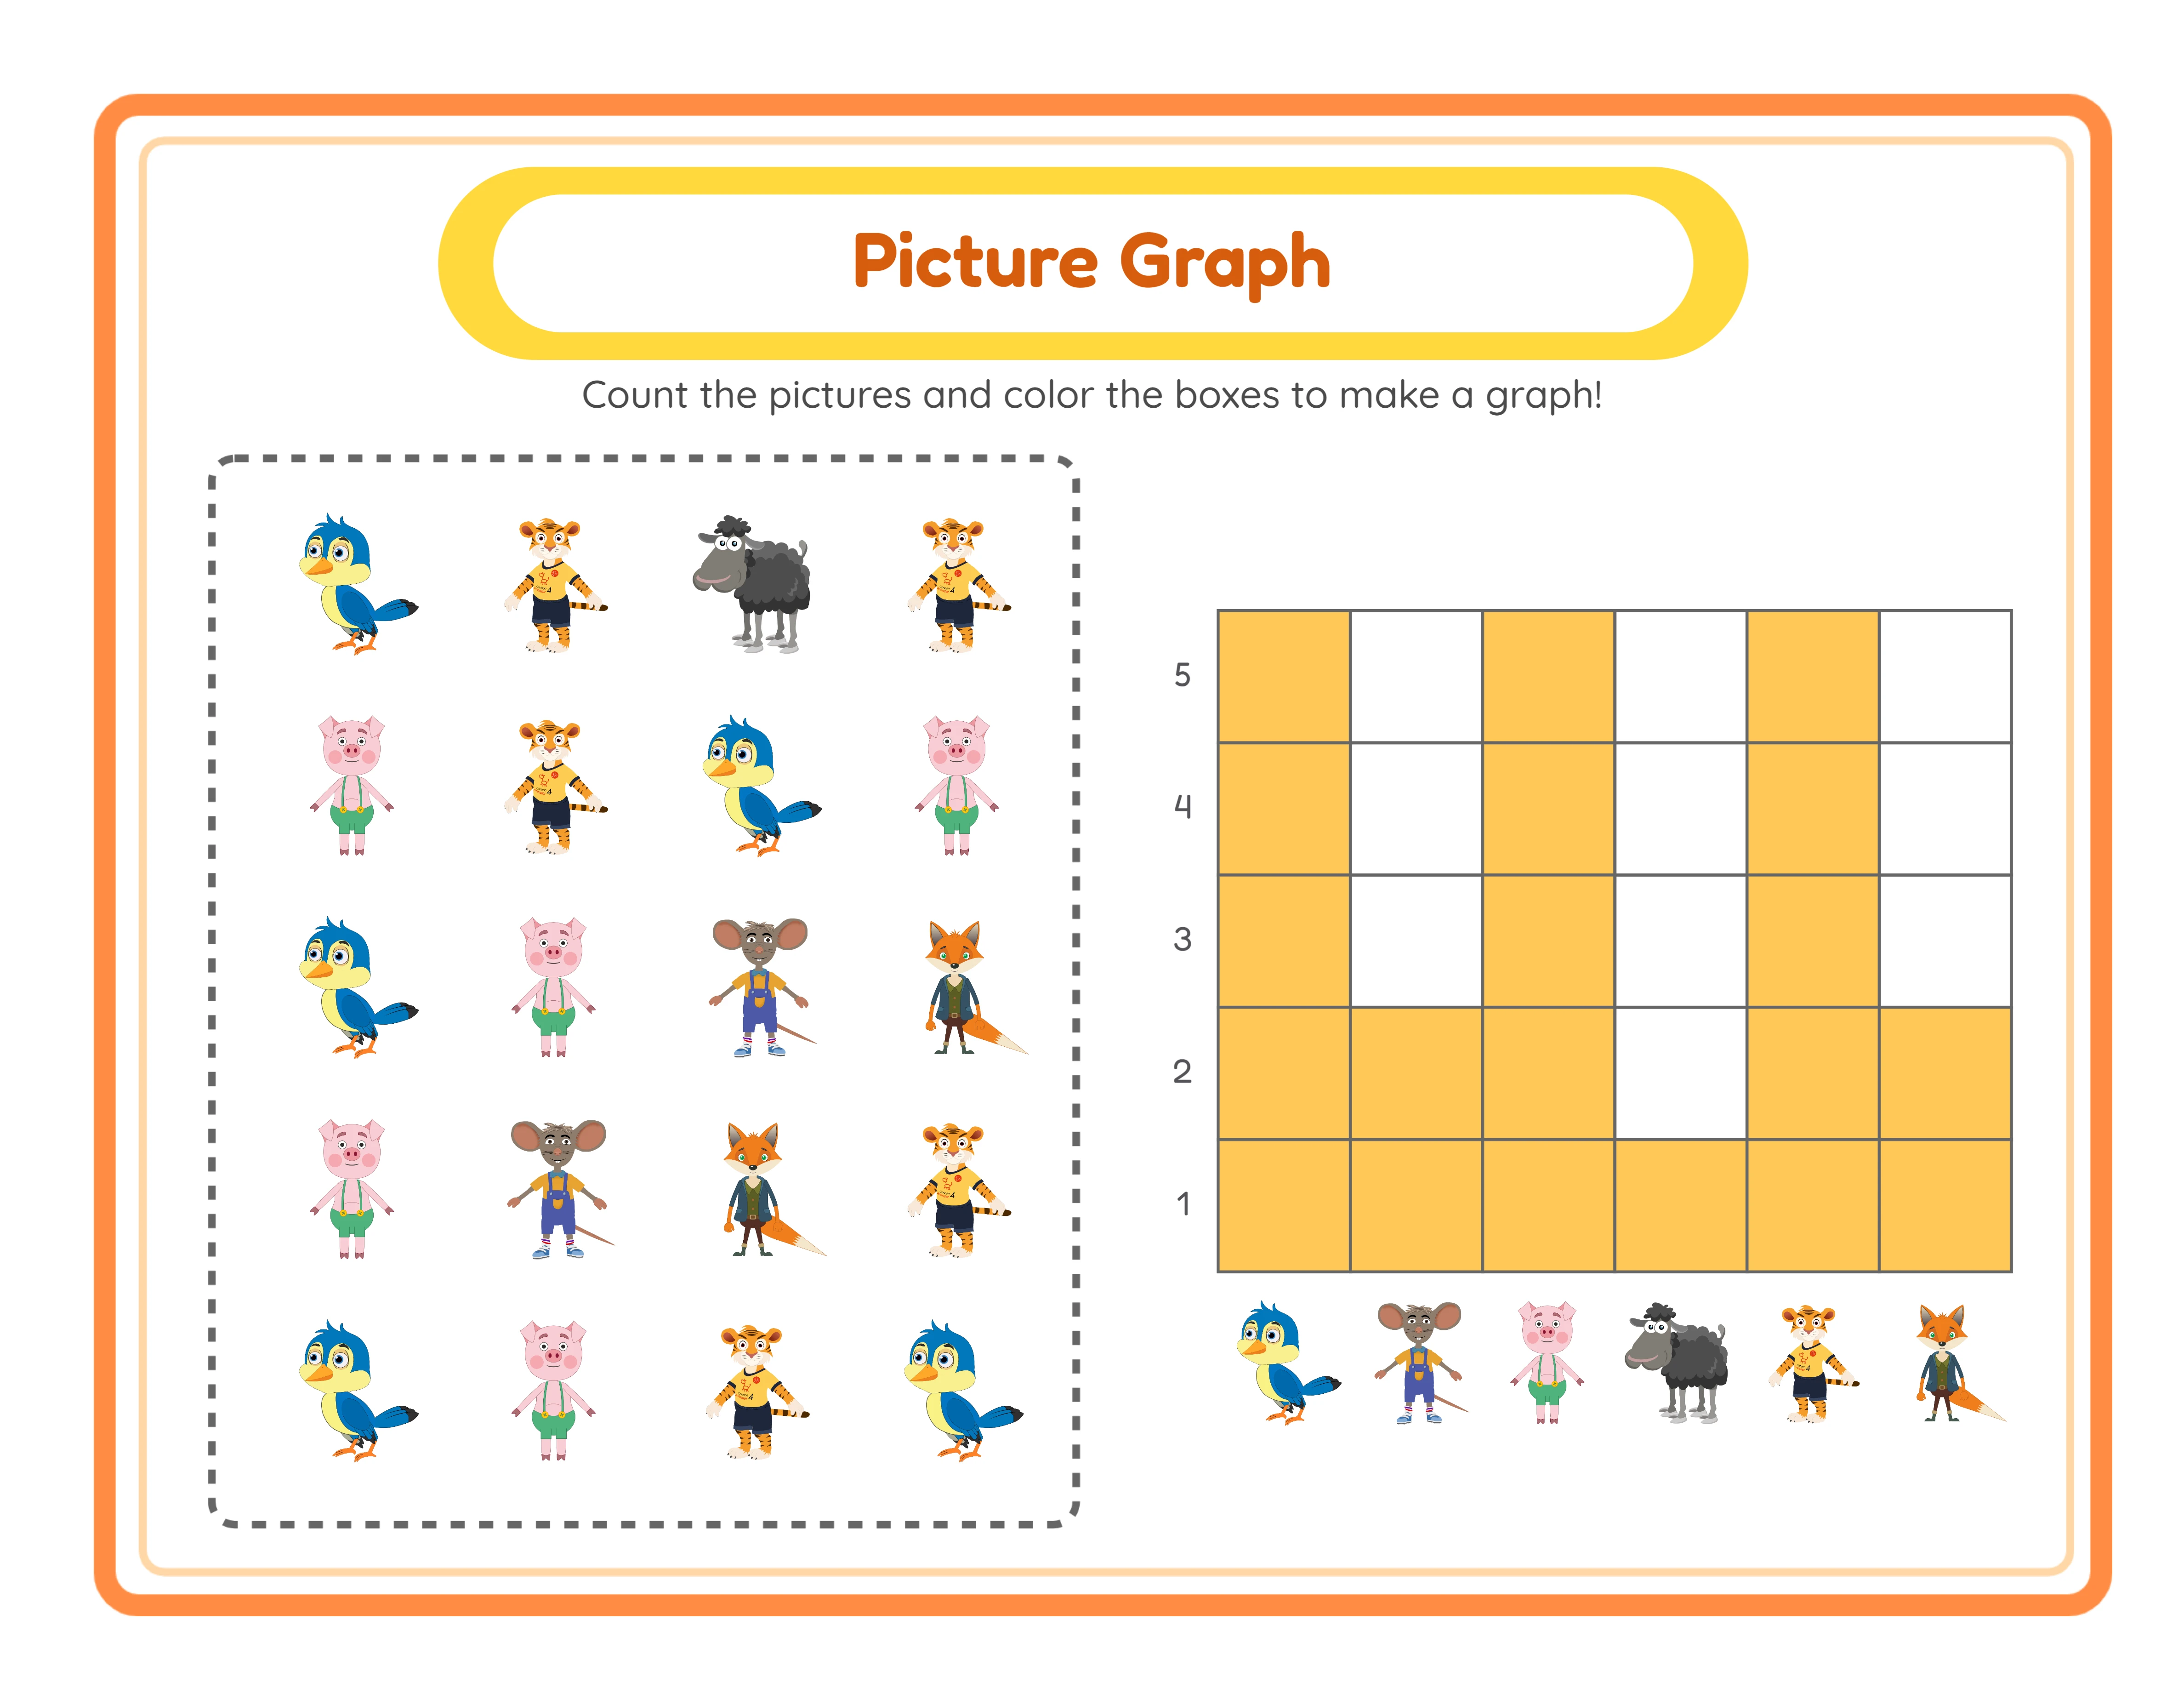
First, it arranges 20 scattered icons from your 6 selected image types in a 4×5 grid with a dashed border at the top of the page. Each image type appears 1–5 times in a random distribution, so every generation produces a unique counting challenge. The scattered arrangement prevents solvers from simply counting rows or columns — they must visually scan and identify each image type individually. Below the grid, a 6-column × 5-row bar chart appears with columns labeled by each image type and rows numbered 1–5 from bottom to top. Solvers count how many of each image type appear in the grid above, then color or fill the corresponding number of cells in the matching column. An auto-generated header displays a localized "Picture Graph" title and counting instructions in a styled yellow pill (#FFD93D) with an orange border frame. This header adapts automatically to all 11 supported languages when you switch the UI language. Examine the generated worksheet carefully. Verify that all 6 image types are clearly distinguishable in the grid. Check that the bar chart labels match the scattered images above. If you want a different random distribution, simply click Generate again — the app produces a completely new arrangement every time.
5

Review the Auto-Generated Answer Key

Click the Answer Key tab next to the Worksheet tab to view the auto-generated solution. The answer key shows the same image grid and bar chart, but the correct cells are filled with yellow (#FFC857) highlighting showing exactly how many of each image type appear in the grid. The answer key generates simultaneously with the worksheet. There is no separate creation step, no manual counting, and no possibility of error. When you click Generate on the Worksheet tab, the Answer Key tab updates at the same time with the matching solution. This dual-canvas system is your biggest production advantage. Competing sellers who create graphing worksheets manually must count every image and fill every answer key cell by hand — a tedious process prone to mistakes. The Chart Count Maker eliminates this entirely. You can generate 15–20 unique worksheets per theme session, each with a verified answer key, in the time it would take to manually create and check a single worksheet. Buyers specifically search for graphing worksheets "with answer key" on every marketplace. Including the answer key with every product is not optional — it is a baseline expectation. The auto-generation feature ensures you never ship a product without one.
6

Add Solver Fields and Customize the Header

Check the Include Name/Date box to add formatted "Name: ____" and "Date: ____" fields to the worksheet (Fredoka 18px #333). This single checkbox transforms a generic printable into a structured group activity. Buyers on Gumroad specifically search for "group-ready" and "print-and-go" resources with solver identification areas built in. The auto-generated header automatically displays the "Picture Graph" title and counting instructions in whichever UI language is active. Switch between English, German, French, Spanish, Portuguese, Italian, Dutch, Swedish, Danish, Norwegian, and Finnish to generate headers in any of these languages. The worksheet content itself — scattered images and numbered bar chart cells — uses universal visual elements that work identically in every language without modification. This localization capability creates a unique product opportunity. You can generate the same worksheet with headers in multiple languages and sell language-specific versions on international marketplaces. One creation session produces globally sellable products with zero translation effort beyond switching the UI language.
7

Customize with Text Tools and Canvas Editing

Use the Text Tools panel to add custom titles, labels, or instructions to your worksheet. Seven font choices are available: Lexend Deca, Baloo 2, Nunito, Quicksand, Fredoka, Arial, and Verdana. Adjust text outline width from 0 to 10 with 0.5-step granularity to create readable headings that stand out against any background. The full Fabric.js canvas supports drag, resize, and rotate operations on every element. Use layer controls to manage stacking order — move elements forward or backward, lock finished elements in place to prevent accidental changes. Zoom from 25% to 300% for precision placement of text and decorative elements. Undo and redo up to 20 history states with Ctrl+Z and Ctrl+Y. This gives you freedom to experiment with layouts, text placement, and styling without worrying about losing earlier work. For product creation, consider adding a custom title like "Count and Graph — Farm Animals" or branded footer text with your shop name. Consistent text styling across a bundle (same font, same size, same position) creates a professional product line that buyers recognize as cohesive and trustworthy.
8

Download All Four Files

The Chart Count Maker produces four files per generation session. The Worksheet tab offers worksheet JPEG and worksheet PDF downloads. The Answer Key tab offers answer key JPEG and answer key PDF downloads. All files render at 300 DPI for professional print quality. Toggle grayscale before downloading for ink-friendly versions ideal for bulk printing and Amazon KDP black-and-white interiors. The grayscale toggle applies to the currently active tab, so you can export a color worksheet with a grayscale answer key or vice versa. For marketplace listings, export the JPEG versions as listing preview images and the PDF versions as your deliverable product files. Buyers want to see exactly what they are purchasing, and the JPEG preview serves this purpose while the PDF maintains perfect formatting across all devices and printers. To build a complete product bundle, generate multiple worksheets by clicking Generate repeatedly with the same or different themes. Each click produces a new random distribution of 20 icons, creating a unique counting challenge. Download all four files after each generation, then organize them into themed folders for your product packages. The free trial with watermark produces fully functional exports with a visible watermark overlay. This lets you evaluate print quality, verify formatting, and create test prints before purchasing a commercial license. The commercial license removes the watermark from all exports, producing clean files ready for sale.
Skill Levels

Worksheets for Every Level

Three difficulty tiers for differentiated content

Beginner
Addition beginner worksheet

Simple picture counting (1-5)

Explorer
More or Less intermediate worksheet

Compare amounts to 10

Expert
Matching advanced worksheet

Advanced 8+ pairs

Professional quality at every difficulty level

Platform Tips

Selling Picture Graph Worksheets on Etsy

Etsy is the largest marketplace for printable educational worksheets, and picture graph worksheets occupy a growing niche within the math category. Title optimization: Include your primary keyword early. Strong examples: "Counting and Graphing Worksheets — Animal Theme — Picture Graph with Answer Key — Printable PDF" or "Picture Graph Activity Sheets — Data Representation — Kindergarten Math Center." Etsy titles can be up to 140 characters — use the full space to capture both broad keywords (counting worksheets, graphing worksheets) and specific keywords (picture graph, bar chart activity). Tags: Use all 13 available tags. Combine broad and specific: "counting worksheets," "picture graph," "graphing activity," "data representation," "bar chart worksheet," "kindergarten math," "math center activity," "printable math worksheets," "counting and graphing," "homeschool math," "group worksheets with answer key," "visual math activity," and similar variations. Listing images: Upload 5–10 images. Include a full-page worksheet preview, a close-up of the scattered image grid, the bar chart section, the answer key with yellow-highlighted cells, and a mockup showing the worksheet printed and in use. The answer key image is a strong selling point — buyers can see exactly what the solution looks like. Pricing: Individual picture graph worksheets with answer key sell at $1.49–$2.99. Themed bundles of 15–20 worksheets sell at $4.99–$8.99. Multi-theme mega bundles of 50+ worksheets sell at $14.99–$24.99.

Selling Picture Graph Worksheets on Amazon KDP

Amazon KDP serves the workbook market, and data skills workbooks are an underserved niche within the activity book category. Instead of selling individual worksheet PDFs, you compile multiple picture graph worksheets into a bound book format. Product format: Create a workbook with 60–100 picture graph worksheets organized by theme, with answer key pages at the end of each section. Use the grayscale toggle for ink-friendly output that reproduces perfectly in black-and-white printing. KDP requires specific interior PDF formatting — 8.5×11 inches is the standard trim size for activity workbooks. Title and subtitle: KDP allows a title and subtitle. Example title: "Counting and Graphing Worksheets for Kids." Example subtitle: "100 Picture Graph Activities with Scattered Image Grids, Bar Charts, and Answer Keys for Ages 4–7." Keywords: KDP provides 7 keyword slots. Use specific phrases: "picture graph worksheets kids," "counting and graphing activity book," "data representation workbook," "bar chart practice preschool," "visual counting worksheets," "math center graphing activities," "kindergarten data skills." Global advantage: Picture graph worksheets use universal visual elements — numbered cells and images. The same KDP interior works identically across all international Amazon marketplaces without translation. One workbook serves every country.

Selling Picture Graph Worksheets on Gumroad

Gumroad (Gumroad) is where sellers search specifically for curriculum-aligned resources, and picture graphs are a standard learning objective in early elementary math curricula. Product descriptions on Gumroad should reference specific skills: data collection, data representation, picture graphs, bar charts, counting, and graphing. Mention the grade level (K–2), the number of worksheets and answer keys included, and alignment to data and measurement standards. Preview files: Gumroad allows you to upload a preview file. Include 2–3 sample worksheets showing the scattered image grid and bar chart, plus one answer key showing the yellow-highlighted cells. Buyers need to see the dual-component format (counting grid + graphing chart) and the included answer key before purchasing. Math center positioning: Buyers heavily buy resources labeled as "math center activities." Picture graph worksheets with name/date fields built in are ideal for independent math centers where solvers work through counting and graphing activities at their own pace. Position your products as "math center ready" or "print-and-go" to capture this search traffic. Gumroad-specific keywords: "math center," "data and graphing," "picture graph activity," "counting and graphing," "data representation," "morning work," "assessment," and "independent practice." These terms match how buyers think about and search for group resources. Bundling on Gumroad: Buyers purchase bundles for entire units. A "Complete Kindergarten Graphing Bundle" with 50 picture graph worksheets covering multiple themes with answer keys for each is a strong Gumroad product.

Chart Count Showcase

See What You Can Create!
Featured chart count worksheet
Data Made Fun!Visual GraphingWith Answer Keys

Monetization Strategies

Pricing Your Picture Graph Worksheet Products

Picture graph worksheets with auto-generated answer keys command slightly higher prices than single-skill worksheets because each product includes both a solver worksheet and a buyer solution — two functional documents per item. Single worksheets with answer key: $1.49–$2.49. These serve as entry-point products and shop traffic generators. Low price, high volume potential, and each listing adds search keywords to your shop. Themed mini-bundles (10–15 worksheets with answer keys): $3.99–$6.99. The sweet spot for Etsy and Gumroad sellers. Each worksheet in the bundle has a unique random distribution, so no two pages are identical. Buyers perceive strong value because they get both worksheets and verified answer keys. Grade-level bundles (25–40 worksheets with answer keys): $8.99–$14.99. Target buyers and homeschool parents who need comprehensive graphing resources for an entire semester or curriculum unit. Complete collections (60–100+ worksheets with answer keys): $19.99–$34.99. These are your highest-revenue products. Position them as "everything you need" solutions for teaching data representation skills across the entire school year. Do not undercut the market. The dual-component format (worksheet + answer key) justifies premium pricing over plain counting worksheets. Start at competitive mid-range pricing and adjust based on actual sales data.

Bundling Strategies for Counting and Graphing Worksheets

The random distribution feature of the Chart Count Maker is your bundling superpower. Every click of Generate produces a completely different counting challenge even with the same 6 images, so you can build large bundles rapidly without repetition. Theme bundles: Group 15–20 worksheets sharing a single theme. "Ocean Animals Counting & Graphing — 20 Picture Graph Worksheets with Answer Keys" is a clear, searchable product. Each worksheet uses the same 6 image types but distributes them differently across the 4×5 grid. Cross-theme bundles: Combine worksheets from multiple related themes. "Animal Kingdom Graphing Bundle" might include farm animals, ocean creatures, jungle animals, and pets — each theme contributing 5–8 worksheets to a larger collection. Cross-curricular bundles: Picture graphs bridge math and other subjects naturally. Create a "Science Graphing Bundle" using animal, nature, and weather themes. Create a "Social Studies Graphing Bundle" using community helpers, vehicles, and professions themes. Cross-curricular products attract buyers from multiple subject areas. Seasonal collections: Holiday and seasonal picture graph packs using Christmas, Halloween, Easter, Valentine's, and back-to-school themes. Release each collection 4–6 weeks before the relevant holiday. Seasonal products drive recurring annual revenue. Always list both individual themes and bundles. Individual listings improve search visibility (more listings means more keywords indexed), while bundles drive higher revenue per transaction.

Cross-Selling with Complementary Math Products

Picture graph worksheets pair naturally with several other math worksheet types, creating cross-selling opportunities that increase average order value. Addition worksheets: Counting scattered images is a pre-addition skill. Solvers who can count "there are 4 cats" are ready to add "4 cats plus 3 dogs equals how many animals?" Create themed bundles that progress from counting and graphing to basic addition using the same image themes. More or Less worksheets: After solvers count and graph image quantities, comparison worksheets ask "are there more cats or more dogs?" This extends counting into quantitative comparison — a natural curriculum progression. Bundle counting, graphing, and comparison worksheets together. Matching worksheets: Visual discrimination — identifying and pairing identical images — is a prerequisite for counting scattered images accurately. Solvers must recognize that "this cat and that cat are the same type" before they can count cats reliably. Matching worksheets serve as warm-up activities before picture graph worksheets. Pattern worksheets: Patterns teach sequential reasoning while picture graphs teach categorical reasoning. Both are foundational math skills that buyers often teach in the same unit. A combined "Visual Math Skills Bundle" with patterns and picture graphs appeals to buyers planning comprehensive math instruction. Promote related products in your Etsy shop sections, Gumroad product descriptions, and Amazon KDP "also by this author" listings. Cross-referencing products within your catalog keeps buyers browsing and increases total purchase value.

Examples

Product Variations by Theme and Difficulty

Here are concrete product examples you can create with the Chart Count Worksheet Maker, organized by theme category and target audience. Animal themes for kindergarten (ages 5–6): Use automatic mode to select from farm animals, ocean creatures, jungle animals, pets, birds, insects, and forest animals. Each theme generates worksheets with 6 recognizable animal types in the scattered grid. Animals are the most searched category for children's educational materials. Create 15–20 worksheets per animal theme — the random distribution ensures every worksheet presents a unique counting challenge. Food themes for preschool (ages 3–5): Fruits, vegetables, baked goods, and snack foods provide instantly recognizable images for the youngest learners. The 4×5 scattered grid with large, colorful food icons makes counting intuitive for children just learning to identify and quantify objects. Keep bundles smaller (10–15 worksheets) for this age group since parents and buyers purchase less volume for preschool activities. Vehicle themes for first grade (ages 6–7): Cars, trucks, planes, boats, construction vehicles, and emergency vehicles appeal to a specific demographic and create products that stand out from typical worksheet aesthetics. First graders can handle the full 6-type, 20-icon format and are ready to practice bar chart skills independently. Nature and seasonal themes for cross-grade products: Weather icons, flowers, trees, leaves, and seasonal items work across all grade levels. These themes create products you can sell year-round and update with seasonal variations (spring flowers, autumn leaves, winter snowflakes, summer beach items).

Creating Multi-Format Educational Bundles

The highest-value printable products combine multiple worksheet formats into comprehensive educational packages. Picture graph worksheets serve as the centerpiece of data skills bundles that teach counting, graphing, comparison, and visual analysis. Kindergarten Data Skills Starter Pack: Combine 20 picture graph worksheets (counting and graphing) with 10 matching worksheets (visual discrimination) and 10 more-or-less comparison worksheets, all using coordinated animal themes. Price the bundle at $12.99–$16.99. Each format teaches a different cognitive skill while maintaining thematic consistency. First Grade Graphing Unit Bundle: Compile 30 picture graph worksheets spanning 6 different themes with answer keys for every worksheet. Add a cover page, instructions page, and solver tracking sheet. This group-ready product positions as a complete graphing unit that buyers can use for 4–6 weeks of math instruction. Price at $14.99–$19.99. Amazon KDP Counting Activity Book: Assemble 80 picture graph worksheets organized into themed chapters (animals, food, vehicles, nature, holidays) with answer key pages at the end of each chapter. Toggle grayscale for ink-friendly output. Add a table of contents and a simple cover. KDP activity books with this page count sell at $6.99–$9.99 and generate ongoing royalties with zero fulfillment work. Etsy Mega Bundle: Combine worksheets from every available theme into a 100+ worksheet collection with complete answer keys. Market this as the "ultimate picture graph bundle" or "complete counting and graphing collection." Price at $24.99–$34.99. This becomes your flagship product that anchors your shop and captures buyers looking for comprehensive resources.

Sample Worksheets

Picture graph worksheet with 20 scattered icons in a 4×5 grid and 6-column bar chart below
Complete picture graph worksheet with scattered image grid and bar chart for solver counting practice
Picture graph answer key with yellow highlighted cells showing correct counts
Auto-generated answer key with yellow-highlighted cells (#FFC857) showing the correct count for each image type

Theme Images

Antelope — themed educational image
Antelope
Armadillo — themed educational image
Armadillo
Bat — themed educational image
Bat
Bear — themed educational image
Bear
Bison — themed educational image
Bison

Professional Worksheet Gallery

Clean, polished layouts ready for your business

Addition professional worksheet
Addition
More or Less professional worksheet
More or Less
Matching professional worksheet
Matching
Print-ReadyProfessional QualityMultiple FormatsAnswer Keys

Frequently Asked Questions

How does the picture graph worksheet format work?
Each worksheet has two connected sections. The top section displays a 4×5 grid containing 20 scattered icons from 6 different image types, with each type appearing 1–5 times in a random distribution. The bottom section shows a 6-column × 5-row bar chart with columns labeled by each image type and rows numbered 1–5. Solvers count how many of each image type appear in the grid, then color or fill the corresponding number of cells in the matching column. This teaches both data collection and data representation in a single activity.
How does the auto-generated answer key work?
When you click Generate, the app simultaneously creates a matching answer key on a separate canvas tab. The answer key shows the same image grid and bar chart, but the correct cells are filled with yellow (#FFC857) highlighting showing the exact count for each image type. Switch between Worksheet and Answer Key tabs to compare. Download each version independently as JPEG and PDF. The automatic answer key eliminates manual counting and ensures accuracy across large worksheet bundles.
Can I choose which images appear on the worksheet?
Yes. The generator offers two image selection modes. Automatic mode selects a theme from the dropdown and the app randomly picks 6 images from that collection. Manual mode lets you browse the Image Library by theme or keyword, then click exactly 6 images with a preview strip showing your selections. You can also upload custom PNG, JPG, or GIF images. Both modes guarantee exactly 6 image types per worksheet for consistent bar chart formatting.
What themes and image collections are available?
The Image Library includes 104 themed collections with 3,100+ colorful illustrations covering animals, food, vehicles, nature, holidays, professions, sports, seasons, household items, and dozens more categories. Each theme provides enough images for the app to randomly select 6 types per worksheet. With 104 themes available, you can create extensive product catalogs where every bundle uses a different visual theme.
Are the worksheets language-sensitive?
No. The scattered images and numbered bar chart cells use universal visual elements — pictures and numbers work identically in every language. The auto-generated header automatically translates the "Picture Graph" title and counting instructions into whichever UI language is active (11 languages supported). The worksheet content itself requires no translation, so one set of products serves a global market.
Can I sell picture graph worksheets I create with this tool?
Yes. A commercial license gives you full rights to sell generated picture graph worksheets on any platform including Etsy, Amazon KDP, Gumroad, Gumroad, Creative Fabrica, and your own website. There are no royalty fees or per-sale charges. You keep 100% of your sales revenue after marketplace fees. The dual-canvas system producing both worksheets and answer keys means every generation session creates a complete, sellable product.
What is the refund policy for commercial licenses?
Every generator offers a free trial with watermark so you can test all features, create sample worksheets, and evaluate output quality before purchasing. The free trial includes the full dual-canvas system, auto-generated answer keys, all 104 themes, background and border themes, localized headers, name/date fields, grayscale export, and every download format. Because you can fully evaluate the product before buying, all commercial license sales are final.

Ready to Start Creating?

Try any generator free with watermark. No signup required.

Browse All Generators